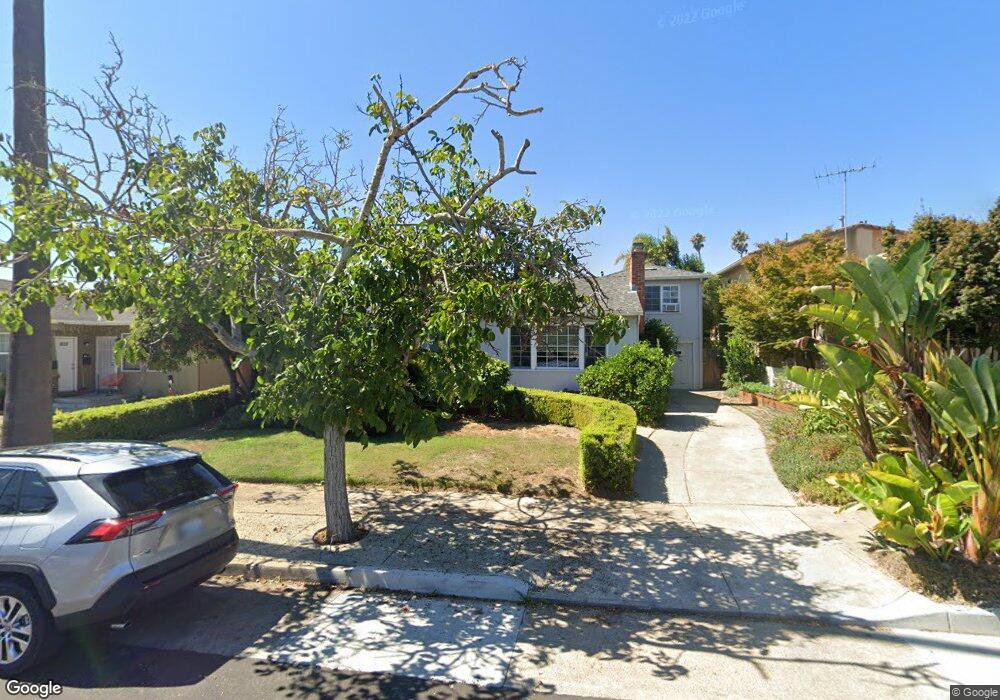
728 S Eldorado St San Mateo, CA 94402
Downtown San Mateo NeighborhoodEstimated Value: $1,505,000 - $1,920,588
3
Beds
2
Baths
1,930
Sq Ft
$921/Sq Ft
Est. Value
About This Home
This home is located at 728 S Eldorado St, San Mateo, CA 94402 and is currently estimated at $1,777,897, approximately $921 per square foot. 728 S Eldorado St is a home located in San Mateo County with nearby schools including Sunnybrae Elementary School, Borel Middle School, and Aragon High School.
Ownership History
Date
Name
Owned For
Owner Type
Purchase Details
Closed on
Oct 13, 2015
Sold by
Fleming Virginia
Bought by
Fleming Virginia
Current Estimated Value
Purchase Details
Closed on
Aug 2, 2010
Sold by
Wasserman Astrid
Bought by
Fleming Virginia
Home Financials for this Owner
Home Financials are based on the most recent Mortgage that was taken out on this home.
Original Mortgage
$560,000
Outstanding Balance
$372,268
Interest Rate
4.65%
Mortgage Type
New Conventional
Estimated Equity
$1,405,629
Purchase Details
Closed on
Nov 19, 1996
Sold by
Brigida Cipolat and Brigida Bridget
Bought by
Wasserman Astrid
Home Financials for this Owner
Home Financials are based on the most recent Mortgage that was taken out on this home.
Original Mortgage
$263,524
Interest Rate
4.95%
Mortgage Type
Purchase Money Mortgage
Create a Home Valuation Report for This Property
The Home Valuation Report is an in-depth analysis detailing your home's value as well as a comparison with similar homes in the area
Home Values in the Area
Average Home Value in this Area
Purchase History
| Date | Buyer | Sale Price | Title Company |
|---|---|---|---|
| Fleming Virginia | -- | None Available | |
| Fleming Virginia | $700,000 | Old Republic Title Company | |
| Wasserman Astrid | $329,500 | North American Title Co |
Source: Public Records
Mortgage History
| Date | Status | Borrower | Loan Amount |
|---|---|---|---|
| Open | Fleming Virginia | $560,000 | |
| Previous Owner | Wasserman Astrid | $263,524 |
Source: Public Records
Tax History Compared to Growth
Tax History
| Year | Tax Paid | Tax Assessment Tax Assessment Total Assessment is a certain percentage of the fair market value that is determined by local assessors to be the total taxable value of land and additions on the property. | Land | Improvement |
|---|---|---|---|---|
| 2025 | $11,643 | $896,810 | $448,405 | $448,405 |
| 2023 | $11,643 | $861,988 | $430,994 | $430,994 |
| 2022 | $12,080 | $845,088 | $422,544 | $422,544 |
| 2021 | $12,086 | $828,518 | $414,259 | $414,259 |
| 2020 | $11,513 | $820,024 | $410,012 | $410,012 |
| 2019 | $11,292 | $803,946 | $401,973 | $401,973 |
| 2018 | $10,504 | $788,184 | $394,092 | $394,092 |
| 2017 | $9,928 | $772,730 | $386,365 | $386,365 |
| 2016 | $9,377 | $757,580 | $378,790 | $378,790 |
| 2015 | $9,556 | $746,202 | $373,101 | $373,101 |
| 2014 | $9,668 | $731,586 | $365,793 | $365,793 |
Source: Public Records
Map
Nearby Homes
- 721 9th Ave
- 724 10th Ave
- 933 S B St
- 225 9th Ave Unit 105
- 222 8th Ave Unit 302
- 222 8th Ave Unit 216
- 217 8th Ave Unit 203
- 930 Rosewood Dr
- 128 Rosewood Dr
- 138 Rosewood Dr
- 118 Rosewood Dr
- 555 Laurel Ave Unit 330
- 104 N Hummingbird Ln
- 1201 S Hummingbird Ln
- 1107 Palm Ave
- 808 Patricia Ave
- 600 Patricia Ave
- 1401 Cary Ave
- 30 Mission Dr
- 1225 Carlisle Dr
- 722 S Eldorado St Unit S
- 808 S Eldorado St Unit S
- 718 S Eldorado St Unit S
- 810 S Eldorado St Unit S
- 803 S Delaware St Unit S
- 723 S Delaware St Unit S
- 805 S Delaware St
- 807 S Delaware St
- 719 S Delaware St Unit S
- 816 S Eldorado St Unit S
- 811 S Delaware St Unit S
- 710 S Eldorado St Unit S
- 715 S Delaware St Unit S
- 815 S Delaware St
- 727 S Eldorado St
- 803 S Eldorado St Unit S
- 711 S Delaware St Unit S
- 721 S Eldorado St Unit S
- 706 S Eldorado St Unit S
- 807 S Eldorado St