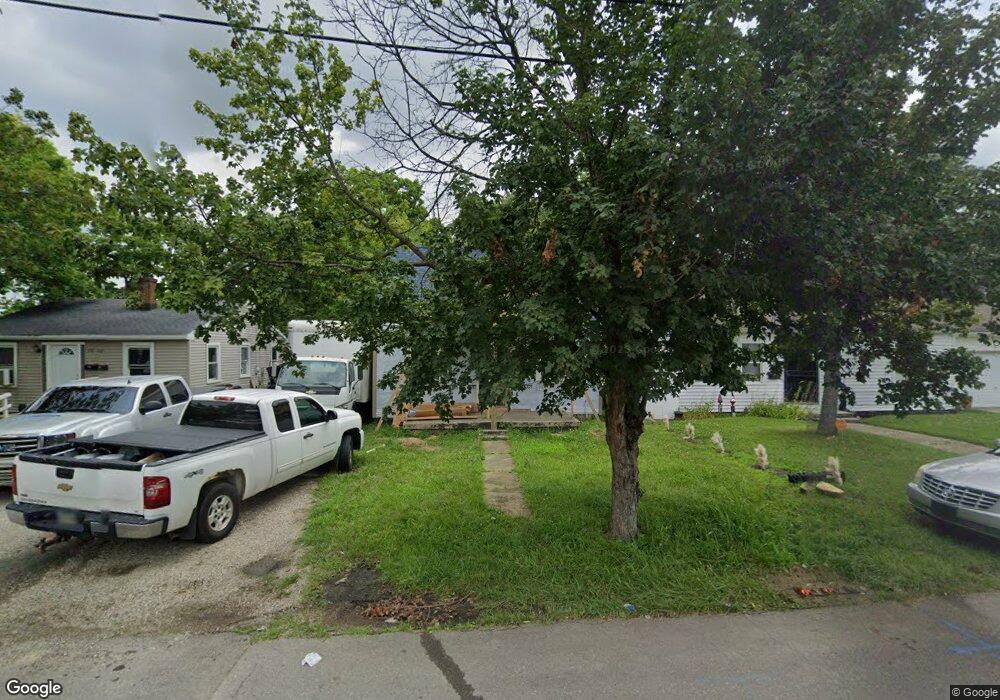
728 Whitmore Ave Dayton, OH 45417
Residence Park NeighborhoodEstimated Value: $53,000 - $98,000
2
Beds
1
Bath
576
Sq Ft
$125/Sq Ft
Est. Value
About This Home
This home is located at 728 Whitmore Ave, Dayton, OH 45417 and is currently estimated at $72,191, approximately $125 per square foot. 728 Whitmore Ave is a home located in Montgomery County with nearby schools including International School at Residence Park, Westwood Elementary, and Louise Troy Elementary.
Ownership History
Date
Name
Owned For
Owner Type
Purchase Details
Closed on
May 10, 2022
Sold by
Allen Properties
Bought by
Ironrent3 Llc
Current Estimated Value
Purchase Details
Closed on
Aug 27, 2020
Sold by
Spa 2 Llc
Bought by
Allen Properties
Purchase Details
Closed on
Dec 12, 2018
Sold by
Ingersoll James and Ingersoll Financial Midwest La
Bought by
Spa 2 Llc
Purchase Details
Closed on
Aug 25, 2016
Sold by
B J Home Services Inc
Bought by
Ingersoll Financial Midwest Land Trust
Purchase Details
Closed on
Aug 24, 2016
Sold by
Kaja Holdings 2 Llc
Bought by
B J Home Services Inc
Purchase Details
Closed on
Aug 13, 2014
Sold by
Parker Tammy and Liberty Savings Bank Fsb
Bought by
Federal Home Loan Mortgage Corporation
Purchase Details
Closed on
Dec 19, 1997
Sold by
Morrison Laymon
Bought by
Parker Tammy and Parker Elmer Mae
Create a Home Valuation Report for This Property
The Home Valuation Report is an in-depth analysis detailing your home's value as well as a comparison with similar homes in the area
Home Values in the Area
Average Home Value in this Area
Purchase History
| Date | Buyer | Sale Price | Title Company |
|---|---|---|---|
| Ironrent3 Llc | -- | Laurito Erin M | |
| Allen Properties | $7,000 | None Available | |
| Spa 2 Llc | $32,582 | Bchh Inc | |
| Ingersoll Financial Midwest Land Trust | $1,000 | None Available | |
| B J Home Services Inc | $1,000 | None Available | |
| Federal Home Loan Mortgage Corporation | $12,000 | None Available | |
| Parker Tammy | $6,000 | -- | |
| Parker Tammy | $6,000 | -- |
Source: Public Records
Tax History Compared to Growth
Tax History
| Year | Tax Paid | Tax Assessment Tax Assessment Total Assessment is a certain percentage of the fair market value that is determined by local assessors to be the total taxable value of land and additions on the property. | Land | Improvement |
|---|---|---|---|---|
| 2024 | $322 | $4,280 | $2,050 | $2,230 |
| 2023 | $322 | $4,280 | $2,050 | $2,230 |
| 2022 | $261 | $3,620 | $1,740 | $1,880 |
| 2021 | $578 | $3,620 | $1,740 | $1,880 |
| 2020 | $333 | $3,620 | $1,740 | $1,880 |
| 2019 | $1,549 | $3,460 | $1,930 | $1,530 |
| 2018 | $386 | $3,460 | $1,930 | $1,530 |
| 2017 | $385 | $3,460 | $1,930 | $1,530 |
| 2016 | $401 | $3,490 | $1,930 | $1,560 |
| 2015 | $313 | $3,490 | $1,930 | $1,560 |
| 2014 | $313 | $3,490 | $1,930 | $1,560 |
| 2012 | -- | $10,720 | $1,790 | $8,930 |
Source: Public Records
Map
Nearby Homes
- 731 Whitmore Ave
- 720 Mia Ave
- 733 Cleverly Rd
- 4643 Laurel Dr
- 4615 Dayview Ave
- 4157 Kammer Ave
- 4126 Kammer Ave
- 4126 Sylvan Dr
- 346 Bungalow Rd
- 332 Roxbury Rd
- 911 N Gettysburg Ave
- 4600 Gardendale Ave
- 605 N Gettysburg Ave
- 4901 Gardendale Ave
- 432 N Gettysburg Ave
- 1303 Graystone Dr
- 72 Patton Ave
- 830 Bedford Ave
- 4930 Porterfield Dr
- 4610 Lotus Dr
- 732 Whitmore Ave
- 722 Whitmore Ave
- 714 Whitmore Ave
- 740 Whitmore Ave
- 725 Sayre Ave
- 729 Whitmore Ave
- 725 Whitmore Ave
- 721 Whitmore Ave
- 737 Whitmore Ave
- 752 Whitmore Ave
- 747 Sayre Ave
- 717 Sayre Ave
- 741 Whitmore Ave
- 717 Whitmore Ave
- 711 Whitmore Ave
- 4647 Oakridge Dr
- 745 Whitmore Ave
- 749 Whitmore Ave
- 4639 Oakridge Dr
- 755 Sayre Ave