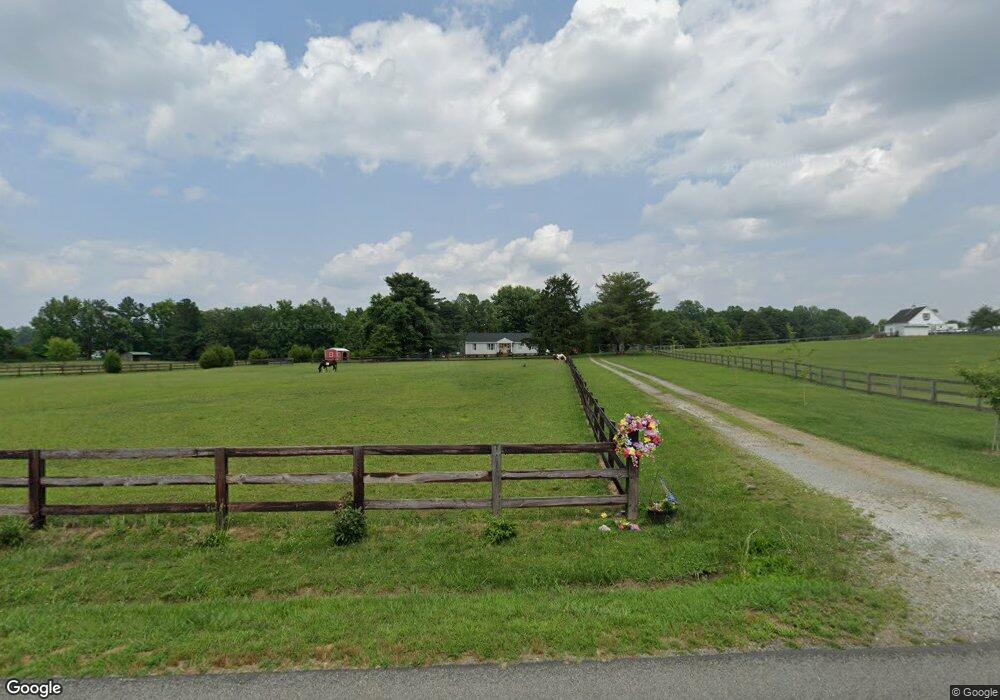
7280 Flannigan Mill Rd Mechanicsville, VA 23111
Estimated Value: $376,000 - $425,000
2
Beds
2
Baths
1,608
Sq Ft
$251/Sq Ft
Est. Value
About This Home
This home is located at 7280 Flannigan Mill Rd, Mechanicsville, VA 23111 and is currently estimated at $404,136, approximately $251 per square foot. 7280 Flannigan Mill Rd is a home located in Hanover County with nearby schools including Battlefield Park Elementary School, Bell Creek Middle School, and Mechanicsville High School.
Ownership History
Date
Name
Owned For
Owner Type
Purchase Details
Closed on
Mar 28, 2018
Sold by
Dews Alton L and Sullivan-Dews Cornelia
Bought by
Hollins Christopher L and Hollins Haley
Current Estimated Value
Home Financials for this Owner
Home Financials are based on the most recent Mortgage that was taken out on this home.
Original Mortgage
$190,400
Outstanding Balance
$163,512
Interest Rate
4.38%
Mortgage Type
New Conventional
Estimated Equity
$240,624
Purchase Details
Closed on
Dec 15, 2006
Sold by
Shirey Kevin S
Bought by
Lewis Alton L
Home Financials for this Owner
Home Financials are based on the most recent Mortgage that was taken out on this home.
Original Mortgage
$160,000
Interest Rate
6.31%
Mortgage Type
New Conventional
Purchase Details
Closed on
Dec 18, 1998
Sold by
Figuly John
Bought by
Longest Jean
Create a Home Valuation Report for This Property
The Home Valuation Report is an in-depth analysis detailing your home's value as well as a comparison with similar homes in the area
Home Values in the Area
Average Home Value in this Area
Purchase History
| Date | Buyer | Sale Price | Title Company |
|---|---|---|---|
| Hollins Christopher L | $238,000 | Bankers Title Llc | |
| Lewis Alton L | $200,000 | -- | |
| Longest Jean | $127,500 | -- |
Source: Public Records
Mortgage History
| Date | Status | Borrower | Loan Amount |
|---|---|---|---|
| Open | Hollins Christopher L | $190,400 | |
| Previous Owner | Lewis Alton L | $160,000 |
Source: Public Records
Tax History Compared to Growth
Tax History
| Year | Tax Paid | Tax Assessment Tax Assessment Total Assessment is a certain percentage of the fair market value that is determined by local assessors to be the total taxable value of land and additions on the property. | Land | Improvement |
|---|---|---|---|---|
| 2025 | $2,457 | $303,300 | $110,600 | $192,700 |
| 2024 | $2,457 | $303,300 | $110,600 | $192,700 |
| 2023 | $2,043 | $265,300 | $98,600 | $166,700 |
| 2022 | $1,964 | $242,500 | $92,500 | $150,000 |
| 2021 | $1,827 | $225,500 | $86,500 | $139,000 |
| 2020 | $1,632 | $201,500 | $81,400 | $120,100 |
| 2019 | $1,573 | $201,500 | $81,400 | $120,100 |
| 2018 | $1,573 | $194,200 | $81,200 | $113,000 |
| 2017 | $1,573 | $194,200 | $81,200 | $113,000 |
| 2016 | $1,573 | $194,200 | $81,200 | $113,000 |
| 2015 | $1,394 | $172,100 | $73,200 | $98,900 |
| 2014 | $1,394 | $172,100 | $73,200 | $98,900 |
Source: Public Records
Map
Nearby Homes
- 2025 Babbling Brooke Ln
- 7114 Prospect Church Rd
- Caldwell Plan at Rock Creek
- Roanoke Plan at Rock Creek
- Charleston Plan at Rock Creek
- Davidson Plan at Rock Creek
- Asheboro Plan at Rock Creek
- McDowell Plan at Rock Creek
- Waverly Plan at Rock Creek
- 7336 Bailie Dr
- The Emerson Plan at Rock Creek
- The Cambridge Plan at Rock Creek
- The Hayden Lee Plan at Rock Creek
- The Charlotte Plan at Rock Creek
- The Madison Plan at Rock Creek
- The Elliott Plan at Rock Creek
- The Becky Plan at Rock Creek
- The Claremont Plan at Rock Creek
- The Lynn Plan at Rock Creek
- The Wilton Plan at Rock Creek
- 2254 Hopewell Rd
- 7318 Flannigan Mill Rd
- 2209 Ettington Ln
- 7300 Flannigan Mill Rd
- 3140 Westwood Hill Rd
- 2255 Westwood Rd
- 2197 Ettington Ln
- 2041 Babbling Brooke Ln
- 3138 Westwood Hill Rd
- 2185 Ettington Ln
- 2056 Babbling Brooke Ln
- 2052 Babbling Brooke Ln
- 7379 Flannigan Mill Rd
- 7385 Flannigan Mill Rd
- 2048 Babbling Brooke Ln
- 2173 Ettington Ln
- 2044 Babbling Brooke Ln
- 0 Babbling Brooke Unit 1004447
- 2039 Babbling Brooke Ln
- 2040 Babbling Brooke Ln