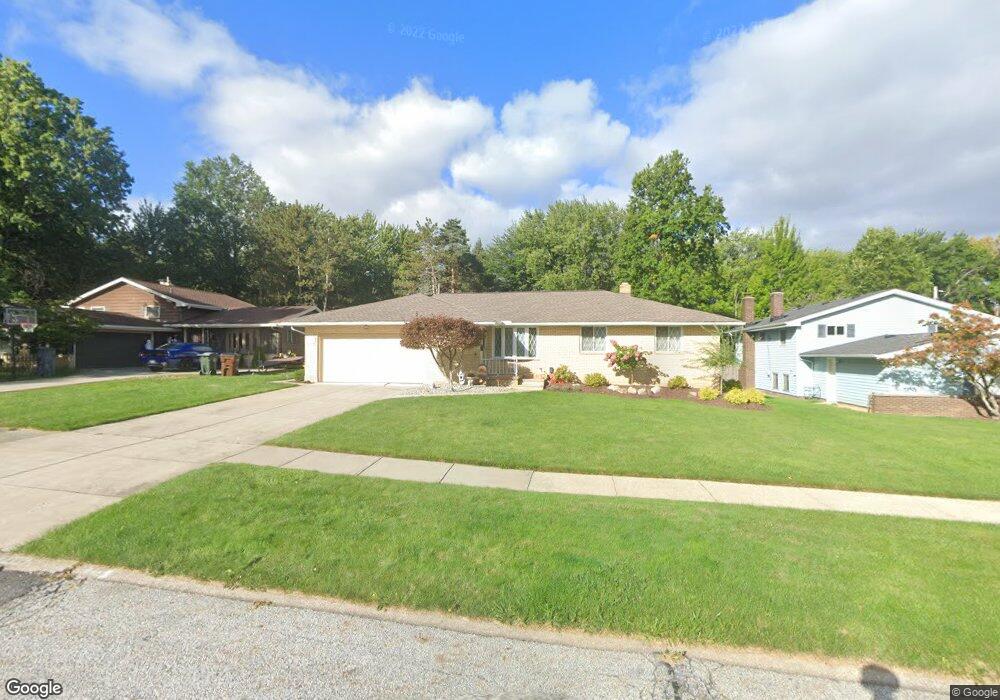
7280 Normandy Dr Cleveland, OH 44134
Estimated Value: $240,000 - $287,000
3
Beds
2
Baths
1,542
Sq Ft
$171/Sq Ft
Est. Value
About This Home
This home is located at 7280 Normandy Dr, Cleveland, OH 44134 and is currently estimated at $263,866, approximately $171 per square foot. 7280 Normandy Dr is a home located in Cuyahoga County with nearby schools including Dentzler Elementary School, Normandy High School, and Hillside Middle School.
Ownership History
Date
Name
Owned For
Owner Type
Purchase Details
Closed on
Oct 6, 2017
Sold by
Kuderna Kimberly and Kuderna Janice
Bought by
Kuderna Kimberly
Current Estimated Value
Purchase Details
Closed on
May 6, 2002
Sold by
Kuderna Janice
Bought by
Kuderna Janice and Kuderna Kimberly
Home Financials for this Owner
Home Financials are based on the most recent Mortgage that was taken out on this home.
Original Mortgage
$102,000
Interest Rate
7.16%
Mortgage Type
Balloon
Purchase Details
Closed on
Apr 1, 1993
Sold by
Kuderna Ray W
Bought by
Kuderna Janice
Purchase Details
Closed on
Dec 1, 1989
Sold by
Kuderna Mary Bernice
Bought by
Kuderna Ray W
Purchase Details
Closed on
Jun 7, 1979
Sold by
Fredrick C Dale
Bought by
Kuderna Mary Bernice
Purchase Details
Closed on
Oct 11, 1978
Sold by
Dale Frederick C and Dale Rose D
Bought by
Fredrick C Dale
Purchase Details
Closed on
Jan 1, 1975
Bought by
Dale Frederick C and Dale Rose D
Create a Home Valuation Report for This Property
The Home Valuation Report is an in-depth analysis detailing your home's value as well as a comparison with similar homes in the area
Home Values in the Area
Average Home Value in this Area
Purchase History
| Date | Buyer | Sale Price | Title Company |
|---|---|---|---|
| Kuderna Kimberly | -- | None Available | |
| Kuderna Janice | -- | -- | |
| Kuderna Janice | -- | -- | |
| Kuderna Ray W | -- | -- | |
| Kuderna Mary Bernice | $70,500 | -- | |
| Fredrick C Dale | -- | -- | |
| Dale Frederick C | -- | -- |
Source: Public Records
Mortgage History
| Date | Status | Borrower | Loan Amount |
|---|---|---|---|
| Closed | Kuderna Janice | $102,000 |
Source: Public Records
Tax History Compared to Growth
Tax History
| Year | Tax Paid | Tax Assessment Tax Assessment Total Assessment is a certain percentage of the fair market value that is determined by local assessors to be the total taxable value of land and additions on the property. | Land | Improvement |
|---|---|---|---|---|
| 2024 | $4,518 | $74,200 | $13,650 | $60,550 |
| 2023 | $4,041 | $57,230 | $11,200 | $46,030 |
| 2022 | $4,006 | $57,230 | $11,200 | $46,030 |
| 2021 | $4,123 | $57,230 | $11,200 | $46,030 |
| 2020 | $3,910 | $48,090 | $9,420 | $38,680 |
| 2019 | $3,748 | $137,400 | $26,900 | $110,500 |
| 2018 | $3,298 | $48,090 | $9,420 | $38,680 |
| 2017 | $2,980 | $43,480 | $7,880 | $35,600 |
| 2016 | $2,962 | $43,480 | $7,880 | $35,600 |
| 2015 | $2,916 | $43,480 | $7,880 | $35,600 |
| 2014 | $2,916 | $44,800 | $8,120 | $36,680 |
Source: Public Records
Map
Nearby Homes
- 4803 Sassafras Dr
- 4402 Stary Dr
- 3200 Dentzler Rd
- 3610 Jeanne Dr
- 7180 Marko Ln
- 7030 Lyle Ave
- 7531 Vista Dr
- 7558 Pleasant View Dr
- 3262 Marda Dr
- 3195 Marda Dr
- 3807 Klusner Ave
- 3711 Klusner Ave
- 2644 Nottingham Dr
- 3011 Klusner Ave
- 2838 Marda Dr
- 2800 Bonny Blvd
- 5810 Ely Vista Dr
- 3430 Park Dr
- 3018 Center Dr
- 2830 Brian Dr
- 7272 Normandy Dr
- 7288 Normandy Dr
- 7260 Normandy Dr
- 7281 Normandy Dr
- 7289 Normandy Dr
- 7251 Normandy Dr
- 7242 Normandy Dr
- 7243 Normandy Dr
- 7234 Normandy Dr
- 7235 Normandy Dr
- 7226 Normandy Dr
- 7227 Normandy Dr
- 7218 Normandy Dr
- 7270 Ward Rd
- 7298 Ward Rd
- 7292 Ward Rd
- 7260 Ward Rd
- 7219 Normandy Dr
- 7302 Ward Rd
- 7240 Ward Rd