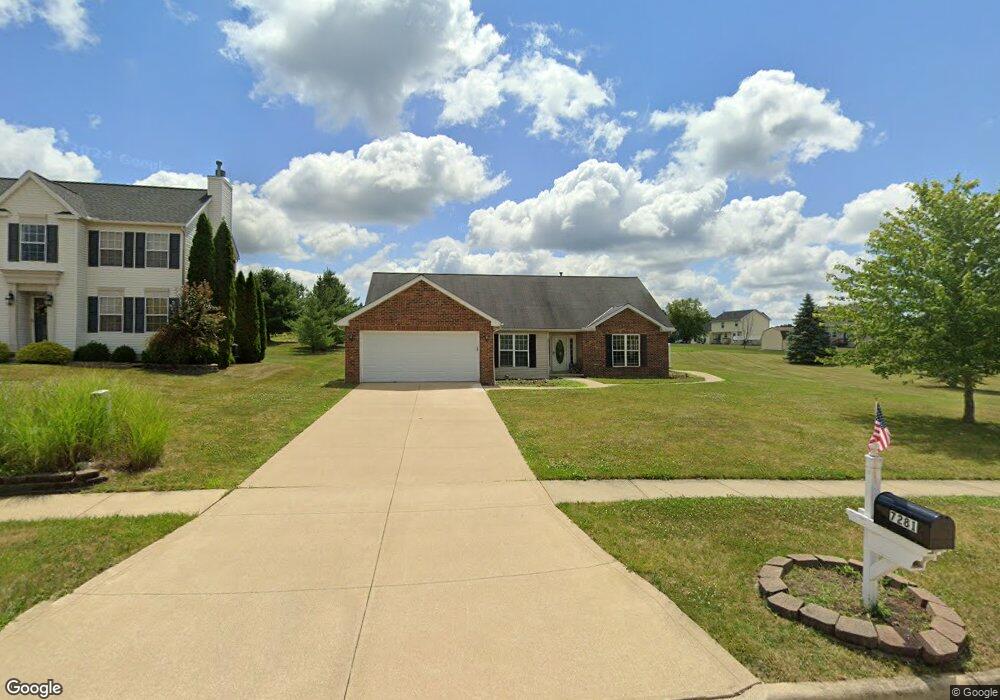
7281 Honey Shade Ct Chippewa Lake, OH 44215
Estimated Value: $379,762
3
Beds
2
Baths
1,752
Sq Ft
$217/Sq Ft
Est. Value
About This Home
This home is located at 7281 Honey Shade Ct, Chippewa Lake, OH 44215 and is currently estimated at $379,762, approximately $216 per square foot. 7281 Honey Shade Ct is a home located in Medina County with nearby schools including Cloverleaf Elementary School, Cloverleaf Middle School, and Cloverleaf High School.
Ownership History
Date
Name
Owned For
Owner Type
Purchase Details
Closed on
Aug 12, 2009
Sold by
Fowler Gene A and Fowler Sandra
Bought by
Medina Metropolitan Housing Authority
Current Estimated Value
Purchase Details
Closed on
Feb 4, 2004
Sold by
Ryan Road Land Corp
Bought by
Foxs Pride Ltd
Purchase Details
Closed on
Jul 25, 2002
Sold by
Sweetbriar Homes Inc
Bought by
Fowler Gene A and Fowler Sandra
Home Financials for this Owner
Home Financials are based on the most recent Mortgage that was taken out on this home.
Original Mortgage
$135,000
Interest Rate
6.7%
Mortgage Type
Commercial
Purchase Details
Closed on
Mar 7, 2001
Sold by
Ryan Road Land Corp
Bought by
Sweet Briar Homes Inc
Home Financials for this Owner
Home Financials are based on the most recent Mortgage that was taken out on this home.
Original Mortgage
$148,280
Interest Rate
7.18%
Mortgage Type
Commercial
Create a Home Valuation Report for This Property
The Home Valuation Report is an in-depth analysis detailing your home's value as well as a comparison with similar homes in the area
Home Values in the Area
Average Home Value in this Area
Purchase History
| Date | Buyer | Sale Price | Title Company |
|---|---|---|---|
| Medina Metropolitan Housing Authority | -- | -- | |
| Foxs Pride Ltd | -- | Title First Agency Inc | |
| Fowler Gene A | $189,000 | -- | |
| Sweet Briar Homes Inc | $34,000 | -- |
Source: Public Records
Mortgage History
| Date | Status | Borrower | Loan Amount |
|---|---|---|---|
| Previous Owner | Fowler Gene A | $135,000 | |
| Previous Owner | Sweet Briar Homes Inc | $148,280 |
Source: Public Records
Tax History Compared to Growth
Tax History
| Year | Tax Paid | Tax Assessment Tax Assessment Total Assessment is a certain percentage of the fair market value that is determined by local assessors to be the total taxable value of land and additions on the property. | Land | Improvement |
|---|---|---|---|---|
| 2024 | $72 | $65,350 | $14,000 | $51,350 |
| 2023 | $72 | $65,350 | $14,000 | $51,350 |
| 2022 | $77 | $65,350 | $14,000 | $51,350 |
| 2021 | $72 | $65,350 | $14,000 | $51,350 |
| 2020 | $72 | $65,350 | $14,000 | $51,350 |
| 2019 | $72 | $65,350 | $14,000 | $51,350 |
| 2018 | $72 | $60,030 | $12,040 | $47,990 |
| 2017 | $0 | $60,030 | $12,040 | $47,990 |
| 2016 | $0 | $60,030 | $12,040 | $47,990 |
| 2015 | -- | $60,030 | $12,040 | $47,990 |
| 2014 | $2 | $60,030 | $12,040 | $47,990 |
| 2013 | $2 | $60,030 | $12,040 | $47,990 |
Source: Public Records
Map
Nearby Homes
- 7303 Meadowhaven Dr
- 7396 Bittersweet Ln
- 7430 Ryan Rd
- 5346 Chippewa Rd
- 5829 Heatherhedge Dr
- 7390 Chestnut St
- 6822 Ryan Rd
- 5987 Chippewa Rd
- 5340 Summerwood Dr
- 5101 Maple Heights Dr
- #5 Lot Chippewa Rd
- Lot #6 Chippewa Rd
- Lot #4 Chippewa Rd
- 5735 Overlook Dr
- 7762 Chesterfield Dr
- 7786 Chesterfield Dr
- 0 Winding Woods Trail
- 4990 Chippewa Rd
- 537 Lee Lore Dr
- 5626 Burlington Dr
- 7275 Honey Shade Ct
- 7269 Honey Shade Ct
- 5553 Shawnee Trail
- 5543 Shawnee Trail
- 7278 Honey Shade Ct
- 5537 Shawnee Trail
- 5523 Shawnee Trail
- 7263 Honey Shade Ct
- 7286 Honey Shade Ct
- 7266 Honey Shade Ct
- 5515 Shawnee Trail
- 7257 Honey Shade Ct
- 7260 Honey Shade Ct
- 7256 Honey Shade Ct
- 5558 Shawnee Trail
- 5550 Shawnee Trail
- 5546 Shawnee Trail
- 5562 Shawnee Trail
- 5540 Shawnee Trail
- 5577 Shawnee Trail