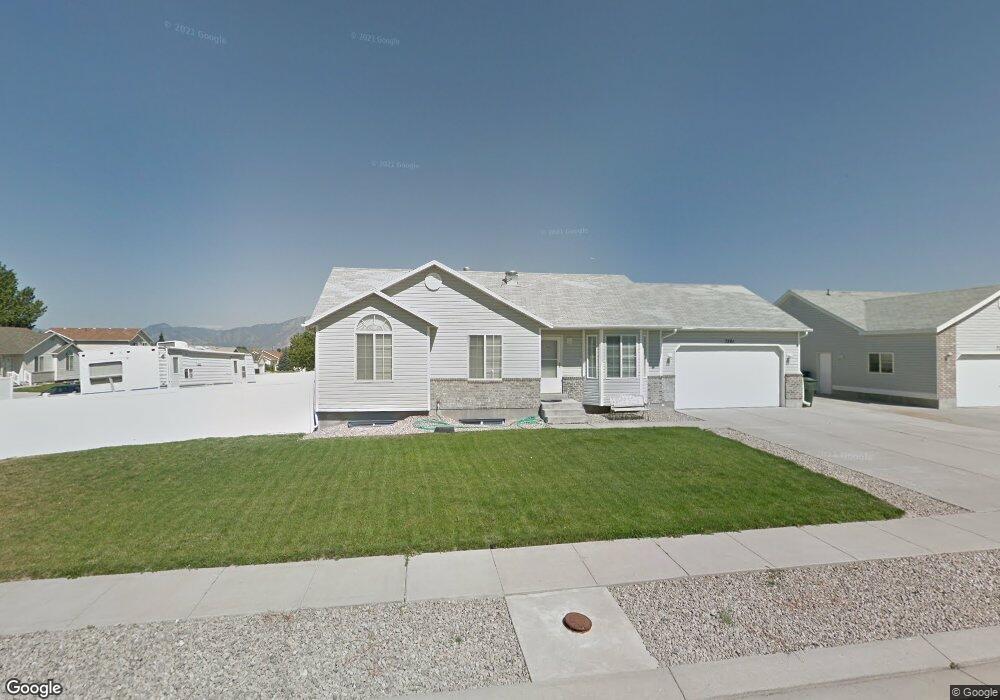
7281 Swan Hill Dr West Jordan, UT 84081
Shadow Mountain NeighborhoodEstimated Value: $535,000 - $572,000
3
Beds
2
Baths
1,465
Sq Ft
$378/Sq Ft
Est. Value
About This Home
This home is located at 7281 Swan Hill Dr, West Jordan, UT 84081 and is currently estimated at $553,264, approximately $377 per square foot. 7281 Swan Hill Dr is a home located in Salt Lake County with nearby schools including Mountain Shadows School, West Hills Middle School, and Copper Hills High School.
Ownership History
Date
Name
Owned For
Owner Type
Purchase Details
Closed on
Mar 25, 2013
Sold by
Lowry Chad B and Lowry Kristal A
Bought by
Lowry Kristal A and Lowry Chad B
Current Estimated Value
Home Financials for this Owner
Home Financials are based on the most recent Mortgage that was taken out on this home.
Original Mortgage
$219,506
Outstanding Balance
$154,619
Interest Rate
3.5%
Mortgage Type
FHA
Estimated Equity
$398,645
Purchase Details
Closed on
Mar 29, 2001
Sold by
Lowry Chad B and Lowry Kristal A
Bought by
Lowry Chad B and Lowry Kristal A
Home Financials for this Owner
Home Financials are based on the most recent Mortgage that was taken out on this home.
Original Mortgage
$42,800
Interest Rate
7.19%
Mortgage Type
Stand Alone Second
Purchase Details
Closed on
Jul 29, 1999
Sold by
D R Horton Inc
Bought by
Lowry Chad B and Lowry Kristal A
Home Financials for this Owner
Home Financials are based on the most recent Mortgage that was taken out on this home.
Original Mortgage
$126,700
Interest Rate
7.64%
Create a Home Valuation Report for This Property
The Home Valuation Report is an in-depth analysis detailing your home's value as well as a comparison with similar homes in the area
Home Values in the Area
Average Home Value in this Area
Purchase History
| Date | Buyer | Sale Price | Title Company |
|---|---|---|---|
| Lowry Kristal A | -- | Richland Title Ins Agency In | |
| Lowry Chad B | -- | United Title Services | |
| Lowry Chad B | -- | Backman Stewart Title Servic |
Source: Public Records
Mortgage History
| Date | Status | Borrower | Loan Amount |
|---|---|---|---|
| Open | Lowry Kristal A | $219,506 | |
| Closed | Lowry Chad B | $42,800 | |
| Closed | Lowry Chad B | $126,700 |
Source: Public Records
Tax History Compared to Growth
Tax History
| Year | Tax Paid | Tax Assessment Tax Assessment Total Assessment is a certain percentage of the fair market value that is determined by local assessors to be the total taxable value of land and additions on the property. | Land | Improvement |
|---|---|---|---|---|
| 2025 | $2,686 | $521,900 | $160,600 | $361,300 |
| 2024 | $2,686 | $516,700 | $154,400 | $362,300 |
| 2023 | $2,468 | $447,500 | $148,500 | $299,000 |
| 2022 | $2,551 | $455,000 | $145,600 | $309,400 |
| 2021 | $2,254 | $366,100 | $112,000 | $254,100 |
| 2020 | $2,138 | $325,900 | $103,000 | $222,900 |
| 2019 | $2,089 | $312,200 | $97,200 | $215,000 |
| 2018 | $1,927 | $285,600 | $97,200 | $188,400 |
| 2017 | $1,875 | $276,700 | $97,200 | $179,500 |
| 2016 | $1,647 | $228,400 | $102,100 | $126,300 |
| 2015 | $1,708 | $230,900 | $109,300 | $121,600 |
| 2014 | $1,665 | $221,600 | $105,800 | $115,800 |
Source: Public Records
Map
Nearby Homes
- 6880 S Survey Peak Ln
- 6884 S Survey Peak Ln
- 6888 S Survey Peak Ln
- 7563 S Opal Mountain Way W Unit 306
- 7567 S Opal Mountain Way W Unit 307
- 7556 S Opal Mountain Way W Unit 311
- 7569 S Opal Mountain Way W Unit 308
- 7554 S Opal Mountain Way W Unit 310
- 7553 S Opal Mountain Way W Unit 302
- 7173 S Kristilyn Ln
- 7138 S Brittany Town Dr
- 7288 Comet Hill Cir
- 5151 Case Mountain Rd
- 7414 Regal Hill Dr
- 7071 S Kristilyn Ln
- 7502 S Lace Wood Dr Unit 417
- 7493 S Lace Wood Dr
- 7093 S Greensand Dr
- 5208 W Case Mountain Rd
- 7246 W Terraine Rd
- 4893 W Thrush Hill Dr
- 4906 Opal Hill Dr
- 5081 Thrush Hill Dr
- 4888 Opal Hill Dr
- 4888 W Opal Hill Dr
- 7282 S Swan Hill Dr
- 7255 S Swan Hill Dr
- 4929 Thrush Hill Dr
- 4881 Thrush Hill Dr
- 4881 W Thrush Hill Dr
- 7296 Swan Hill Dr
- 7296 S Swan Hill Dr
- 4892 Thrush Hill Dr
- 4878 Opal Hill Dr
- 7255 Swan Hill Dr
- 7256 S Swan Hill Dr
- 7256 Swan Hill Dr
- 4876 W Thrush Hill Dr
- 4876 Thrush Hill Dr
- 4945 Thrush Hill Dr