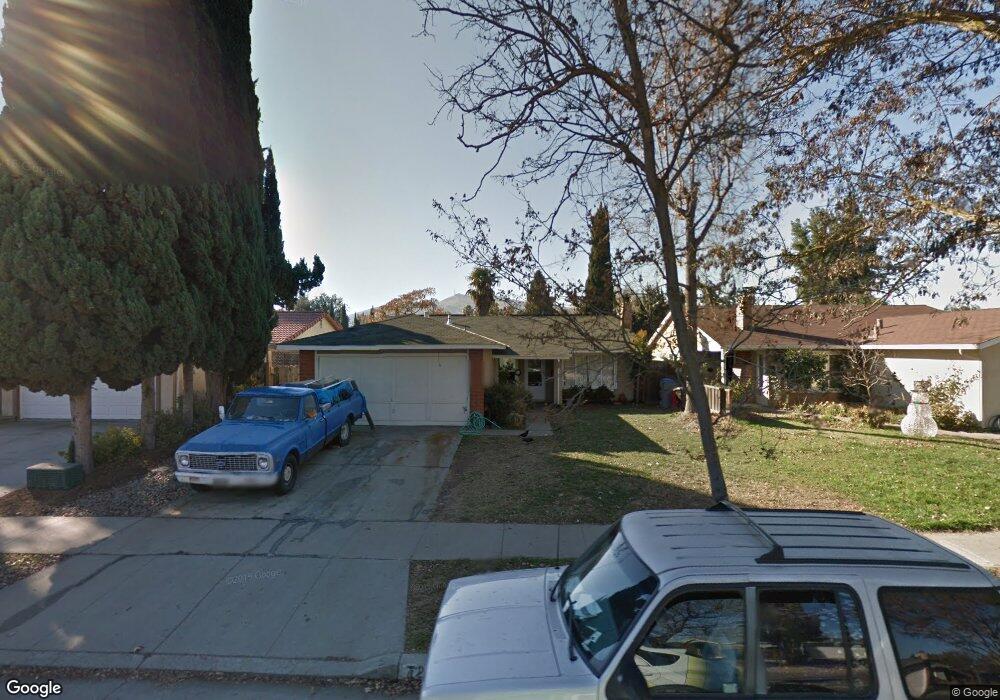
7287 Middlebury Way San Jose, CA 95139
Los Paseos NeighborhoodEstimated Value: $1,163,438 - $1,383,000
3
Beds
2
Baths
1,120
Sq Ft
$1,113/Sq Ft
Est. Value
About This Home
This home is located at 7287 Middlebury Way, San Jose, CA 95139 and is currently estimated at $1,247,110, approximately $1,113 per square foot. 7287 Middlebury Way is a home located in Santa Clara County with nearby schools including Los Paseos Elementary School, Martin Murphy Middle School, and Ann Sobrato High School.
Ownership History
Date
Name
Owned For
Owner Type
Purchase Details
Closed on
May 16, 2005
Sold by
Gifford Toni A
Bought by
Gifford Toni A
Current Estimated Value
Home Financials for this Owner
Home Financials are based on the most recent Mortgage that was taken out on this home.
Original Mortgage
$315,000
Outstanding Balance
$164,559
Interest Rate
5.87%
Mortgage Type
New Conventional
Estimated Equity
$1,082,551
Purchase Details
Closed on
Aug 7, 2001
Sold by
Gifford Toni A and Gifford Ron W
Bought by
Gifford Ron W and Gifford Toni A
Home Financials for this Owner
Home Financials are based on the most recent Mortgage that was taken out on this home.
Original Mortgage
$281,000
Interest Rate
7.1%
Purchase Details
Closed on
Dec 28, 1994
Sold by
Moberg Kim
Bought by
Gifford Ron W and Gifford Toni A
Home Financials for this Owner
Home Financials are based on the most recent Mortgage that was taken out on this home.
Original Mortgage
$170,000
Interest Rate
7.62%
Create a Home Valuation Report for This Property
The Home Valuation Report is an in-depth analysis detailing your home's value as well as a comparison with similar homes in the area
Home Values in the Area
Average Home Value in this Area
Purchase History
| Date | Buyer | Sale Price | Title Company |
|---|---|---|---|
| Gifford Toni A | -- | United Capital Title Ins Co | |
| Gifford Ron W | -- | Financial Title Company | |
| Gifford Ron W | $179,000 | Old Republic Title Company |
Source: Public Records
Mortgage History
| Date | Status | Borrower | Loan Amount |
|---|---|---|---|
| Open | Gifford Toni A | $315,000 | |
| Closed | Gifford Ron W | $281,000 | |
| Closed | Gifford Ron W | $170,000 |
Source: Public Records
Tax History Compared to Growth
Tax History
| Year | Tax Paid | Tax Assessment Tax Assessment Total Assessment is a certain percentage of the fair market value that is determined by local assessors to be the total taxable value of land and additions on the property. | Land | Improvement |
|---|---|---|---|---|
| 2025 | $4,808 | $300,631 | $119,242 | $181,389 |
| 2024 | $4,808 | $294,737 | $116,904 | $177,833 |
| 2023 | $4,808 | $288,959 | $114,612 | $174,347 |
| 2022 | $4,629 | $283,294 | $112,365 | $170,929 |
| 2021 | $4,457 | $277,740 | $110,162 | $167,578 |
| 2020 | $4,287 | $274,893 | $109,033 | $165,860 |
| 2019 | $4,329 | $269,504 | $106,896 | $162,608 |
| 2018 | $4,284 | $264,220 | $104,800 | $159,420 |
| 2017 | $4,230 | $259,041 | $102,746 | $156,295 |
| 2016 | $3,985 | $253,963 | $100,732 | $153,231 |
| 2015 | $4,058 | $250,149 | $99,219 | $150,930 |
| 2014 | $3,810 | $245,250 | $97,276 | $147,974 |
Source: Public Records
Map
Nearby Homes
- 45 Cheltenham Way
- 7392 Tulare Hill Dr
- 133 Cheltenham Way
- 6986 Gregorich Dr Unit C
- 6958 Gregorich Dr Unit G
- 6945 Rodling Dr Unit C
- 7270 Alder Spring Way
- 202 French Ct
- 7237 Longhill Way
- 7260 Clear Vista Ct
- 6901 Rodling Dr Unit D
- 6130 Monterey Rd Unit 201
- 6130 Monterey Rd Unit 289
- 6130 Monterey Rd Unit 9
- 6130 Monterey Rd Unit 159
- 6130 Monterey Rd Unit 316
- 7189 Rosencrans Way
- 219 Fairway Glen Ln
- 1083 Esparanza Way
- 1075 Esparanza Way
- 7281 Middlebury Way
- 7293 Middlebury Way
- 7275 Middlebury Way
- 7292 Taranga Ct
- 7296 Taranga Ct
- 59 Essendon Way
- 61 Essendon Way
- 55 Essendon Way
- 7288 Taranga Ct
- 7269 Middlebury Way
- 7288 Middlebury Way
- 7280 Middlebury Way
- 63 Essendon Way
- 7294 Middlebury Way
- 7263 Middlebury Way
- 65 Essendon Way
- 7284 Taranga Ct
- 44 Kittery Ct
- 43 Kent Ct
- 49 Kittery Ct