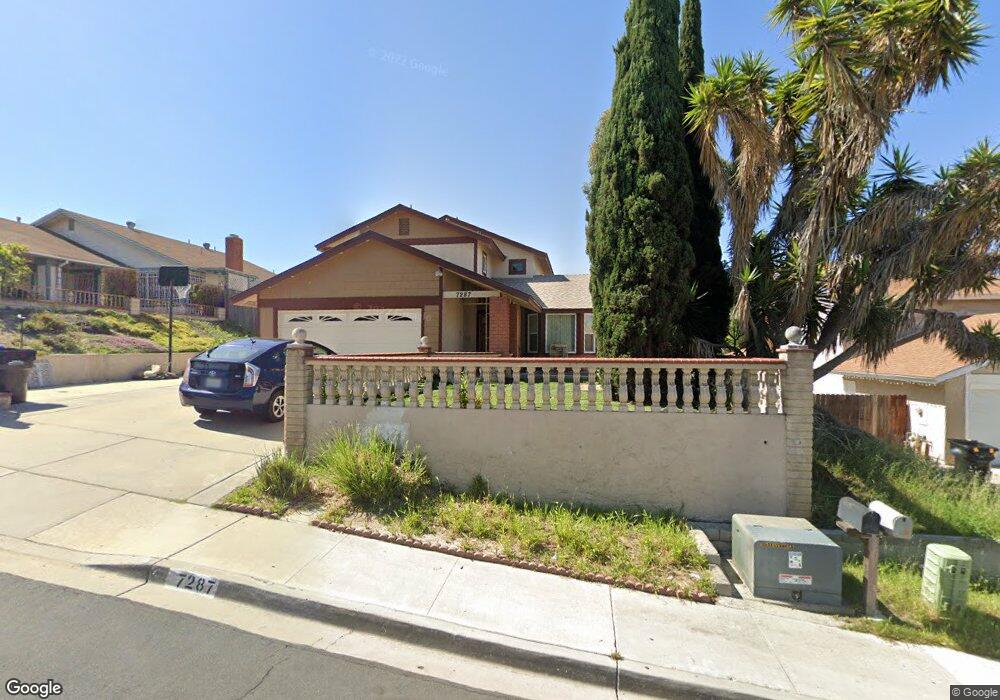
7287 Zest St San Diego, CA 92139
Bay Terraces NeighborhoodEstimated Value: $751,000 - $853,000
4
Beds
3
Baths
1,681
Sq Ft
$467/Sq Ft
Est. Value
About This Home
This home is located at 7287 Zest St, San Diego, CA 92139 and is currently estimated at $784,548, approximately $466 per square foot. 7287 Zest St is a home located in San Diego County with nearby schools including Zamorano Elementary School, Bell Middle School, and Morse High School.
Ownership History
Date
Name
Owned For
Owner Type
Purchase Details
Closed on
May 26, 2016
Sold by
Rabusa Jerry Galan and Rabusa Alicia Rojas
Bought by
The Rabusa Family Trust and Rabusa Alicia Rojas
Current Estimated Value
Home Financials for this Owner
Home Financials are based on the most recent Mortgage that was taken out on this home.
Original Mortgage
$135,000
Interest Rate
3.61%
Mortgage Type
New Conventional
Purchase Details
Closed on
Mar 12, 2015
Sold by
Rabusa Jerry G and Rabusa Alicia R
Bought by
Rabusa Family Trust and Rabusa Alicia Rojas
Purchase Details
Closed on
Jan 18, 1999
Sold by
Jose Oscar G and Jose Erlinda T
Bought by
Rabusa Jerry G and Rabusa Alicia R
Home Financials for this Owner
Home Financials are based on the most recent Mortgage that was taken out on this home.
Original Mortgage
$171,000
Interest Rate
6.78%
Purchase Details
Closed on
Mar 23, 1983
Create a Home Valuation Report for This Property
The Home Valuation Report is an in-depth analysis detailing your home's value as well as a comparison with similar homes in the area
Home Values in the Area
Average Home Value in this Area
Purchase History
| Date | Buyer | Sale Price | Title Company |
|---|---|---|---|
| The Rabusa Family Trust | -- | Chicago | |
| Rabusa Jerry Galan | -- | Chicago Title Company | |
| Rabusa Family Trust | -- | None Available | |
| Rabusa Jerry G | $180,000 | South Coast Title | |
| -- | $98,500 | -- |
Source: Public Records
Mortgage History
| Date | Status | Borrower | Loan Amount |
|---|---|---|---|
| Previous Owner | Rabusa Jerry Galan | $135,000 | |
| Previous Owner | Rabusa Jerry G | $171,000 |
Source: Public Records
Tax History Compared to Growth
Tax History
| Year | Tax Paid | Tax Assessment Tax Assessment Total Assessment is a certain percentage of the fair market value that is determined by local assessors to be the total taxable value of land and additions on the property. | Land | Improvement |
|---|---|---|---|---|
| 2025 | $3,432 | $282,160 | $80,238 | $201,922 |
| 2024 | $3,432 | $276,628 | $78,665 | $197,963 |
| 2023 | $3,356 | $271,205 | $77,123 | $194,082 |
| 2022 | $3,267 | $265,888 | $75,611 | $190,277 |
| 2021 | $3,245 | $260,676 | $74,129 | $186,547 |
| 2020 | $3,206 | $258,004 | $73,369 | $184,635 |
| 2019 | $3,149 | $252,946 | $71,931 | $181,015 |
| 2018 | $2,945 | $247,987 | $70,521 | $177,466 |
| 2017 | $2,875 | $243,126 | $69,139 | $173,987 |
| 2016 | $2,829 | $238,360 | $67,784 | $170,576 |
| 2015 | $2,787 | $234,780 | $66,766 | $168,014 |
| 2014 | $2,744 | $230,182 | $65,459 | $164,723 |
Source: Public Records
Map
Nearby Homes
- 763 Kingswood St
- 7549 Goode St
- 240 Ledgewood Ln
- 7449 Bullock Dr
- 7040 Tenbury Ct
- 177 Coralwood Dr
- 1153 Manzana Way
- 2620 Pennington Ln
- 6872 Quebec Ct Unit 5
- 110 Ultramarine Rd
- 124 Palawan Way
- 1403 Manzana Way
- 7263 Aquamarine Rd
- 7089 Wattle Dr
- 2876 Casey St Unit B
- 7281 Danawoods Ct
- 2920 Briarwood Rd Unit B1
- 2920 Briarwood Rd
- 2920 Briarwood Rd Unit G11
- 2920 Briarwood Rd Unit C15