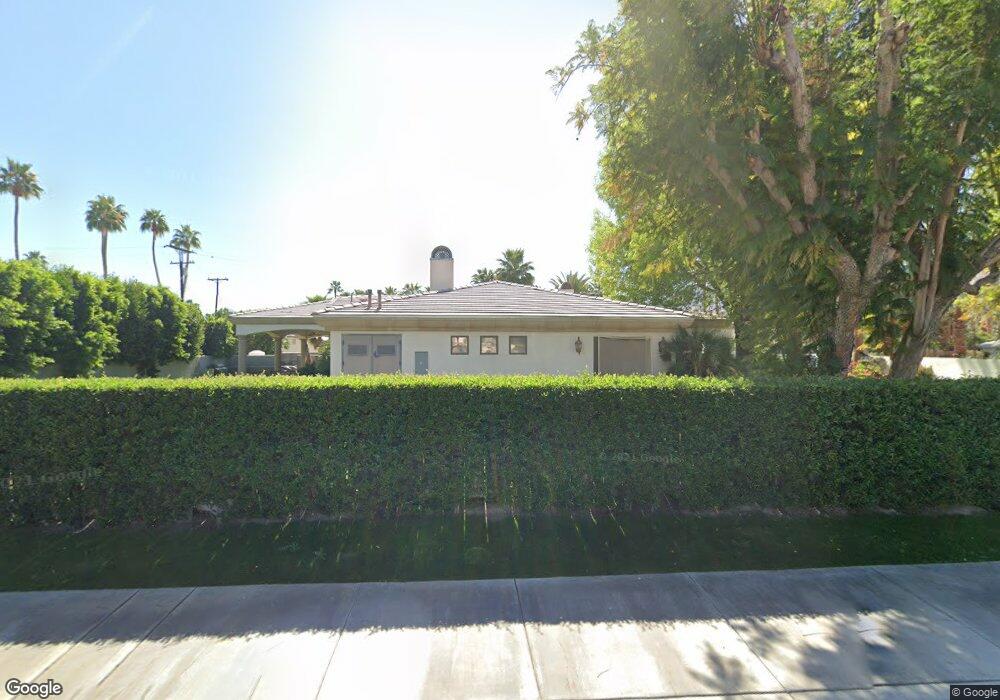
72875 Parkview Dr Palm Desert, CA 92260
Estimated Value: $979,000 - $1,697,000
4
Beds
6
Baths
4,273
Sq Ft
$293/Sq Ft
Est. Value
About This Home
This home is located at 72875 Parkview Dr, Palm Desert, CA 92260 and is currently estimated at $1,250,051, approximately $292 per square foot. 72875 Parkview Dr is a home located in Riverside County with nearby schools including Abraham Lincoln Elementary School, Colonel Mitchell Paige Middle School, and Palm Desert High School.
Ownership History
Date
Name
Owned For
Owner Type
Purchase Details
Closed on
Feb 16, 2021
Sold by
Vorwaller Beverly
Bought by
Vorwaller Beverly Schelly and The Lemon Square Trust
Current Estimated Value
Purchase Details
Closed on
Dec 6, 2019
Sold by
Sheldon Vorwaller E
Bought by
Vorwaller Beverly
Purchase Details
Closed on
Jun 23, 2004
Sold by
Vorwaller Eugene S and Vorwaller Beverly L
Bought by
Vorwaller E Sheldon and Vorwaller Beverly
Purchase Details
Closed on
Jan 29, 1998
Sold by
Nissen David L and Nissen Jolene
Bought by
Vorwaller Eugene S and Vorwaller Beverly L
Home Financials for this Owner
Home Financials are based on the most recent Mortgage that was taken out on this home.
Original Mortgage
$132,800
Interest Rate
7%
Mortgage Type
Purchase Money Mortgage
Create a Home Valuation Report for This Property
The Home Valuation Report is an in-depth analysis detailing your home's value as well as a comparison with similar homes in the area
Home Values in the Area
Average Home Value in this Area
Purchase History
| Date | Buyer | Sale Price | Title Company |
|---|---|---|---|
| Vorwaller Beverly Schelly | -- | None Available | |
| Vorwaller Beverly | -- | None Available | |
| Vorwaller E Sheldon | -- | -- | |
| Vorwaller Eugene S | $167,000 | Benefit Land Title Ins Co |
Source: Public Records
Mortgage History
| Date | Status | Borrower | Loan Amount |
|---|---|---|---|
| Previous Owner | Vorwaller Eugene S | $132,800 | |
| Closed | Vorwaller Eugene S | $16,600 |
Source: Public Records
Tax History Compared to Growth
Tax History
| Year | Tax Paid | Tax Assessment Tax Assessment Total Assessment is a certain percentage of the fair market value that is determined by local assessors to be the total taxable value of land and additions on the property. | Land | Improvement |
|---|---|---|---|---|
| 2025 | $10,193 | $791,973 | $60,659 | $731,314 |
| 2023 | $10,193 | $761,221 | $58,304 | $702,917 |
| 2022 | $8,680 | $667,864 | $57,161 | $610,703 |
| 2021 | $8,457 | $654,770 | $56,041 | $598,729 |
| 2020 | $8,303 | $648,057 | $55,467 | $592,590 |
| 2019 | $8,146 | $635,351 | $54,380 | $580,971 |
| 2018 | $7,993 | $622,894 | $53,315 | $569,579 |
| 2017 | $7,829 | $610,681 | $52,270 | $558,411 |
| 2016 | $7,637 | $598,708 | $51,246 | $547,462 |
| 2015 | $7,655 | $589,717 | $50,477 | $539,240 |
| 2014 | $7,413 | $578,167 | $49,489 | $528,678 |
Source: Public Records
Map
Nearby Homes
- 43740 Acacia Dr
- 72806 Fleetwood Cir
- 72834 Fleetwood Cir
- 109 Torremolinos Dr
- 133 Torremolinos Dr
- 344 Vista Royal Dr
- 25 Vistara Dr
- 15 Florentina Dr
- 72872 Sonora Dr
- 164 Castellana S
- 172 Castellana S
- 44 San Sebastian Dr Unit 375
- 72815 Tampico Dr
- 111 Juan Cir
- 73228 Santa Rosa Way
- 72440 Brushwood Dr
- 72794 Rancho Grande Dr
- 179 Gran Viaduct
- 72424 Desert Dr
- 72374 Rancho Rd
- 72905 Parkview Dr
- 72890 Mimosa Dr
- 72870 Mimosa Dr
- 72862 Parkview Dr
- 43577 Acacia Dr
- 72860 San Juan Dr
- 72783 Fleetwood Cir
- 72781 Fleetwood Cir
- 72779 Fleetwood Cir
- 72985 Mimosa Dr
- 72840 San Juan Dr
- 72777 Fleetwood Cir
- 72775 Fleetwood Cir
- 72895 Mimosa Dr
- 72875 Mimosa Dr
- 72773 Fleetwood Cir
- 43663 Acacia Dr
- 72855 Mimosa Dr
- 72785 Fleetwood Cir
- 72771 Fleetwood Cir