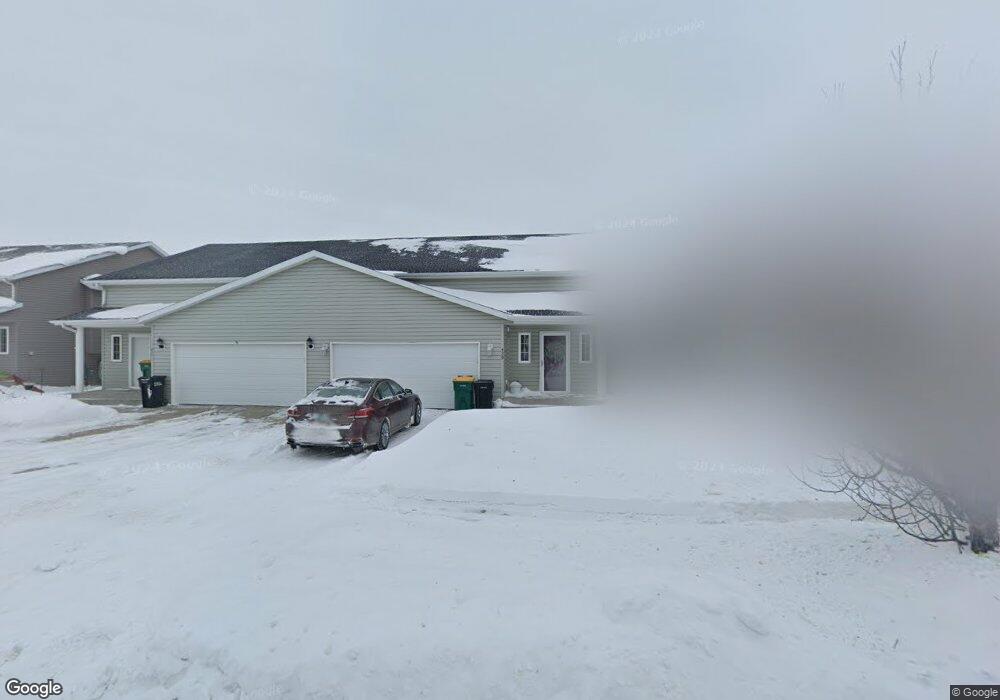
729 13 1 2 Ave S West Fargo, ND 58078
Charleswood NeighborhoodEstimated Value: $257,000 - $279,696
3
Beds
2
Baths
1,842
Sq Ft
$145/Sq Ft
Est. Value
About This Home
This home is located at 729 13 1 2 Ave S, West Fargo, ND 58078 and is currently estimated at $266,174, approximately $144 per square foot. 729 13 1 2 Ave S is a home located in Cass County with nearby schools including South Elementary School, Cheney Middle School, and West Fargo High School.
Ownership History
Date
Name
Owned For
Owner Type
Purchase Details
Closed on
Feb 16, 2018
Sold by
Simmons Michael V and Simmons Samantha A
Bought by
Brosowske Karla A and Brosowske Christopher
Current Estimated Value
Home Financials for this Owner
Home Financials are based on the most recent Mortgage that was taken out on this home.
Original Mortgage
$179,586
Outstanding Balance
$153,629
Interest Rate
4.4%
Mortgage Type
FHA
Estimated Equity
$112,545
Purchase Details
Closed on
Sep 14, 2015
Sold by
Lemke Scott and Lemke Sarah
Bought by
Simmons Michael V and Brouillard Samantha A
Home Financials for this Owner
Home Financials are based on the most recent Mortgage that was taken out on this home.
Original Mortgage
$163,207
Interest Rate
4.8%
Mortgage Type
FHA
Purchase Details
Closed on
Jan 4, 2008
Sold by
Jordahl Custom Homes Inc
Bought by
Lemke Scott and Lemke Dennis Sarah
Home Financials for this Owner
Home Financials are based on the most recent Mortgage that was taken out on this home.
Original Mortgage
$124,155
Interest Rate
6.27%
Mortgage Type
New Conventional
Create a Home Valuation Report for This Property
The Home Valuation Report is an in-depth analysis detailing your home's value as well as a comparison with similar homes in the area
Home Values in the Area
Average Home Value in this Area
Purchase History
| Date | Buyer | Sale Price | Title Company |
|---|---|---|---|
| Brosowske Karla A | $182,900 | Title Co | |
| Simmons Michael V | $166,300 | Title Co | |
| Lemke Scott | -- | -- |
Source: Public Records
Mortgage History
| Date | Status | Borrower | Loan Amount |
|---|---|---|---|
| Open | Brosowske Karla A | $179,586 | |
| Previous Owner | Simmons Michael V | $163,207 | |
| Previous Owner | Lemke Scott | $124,155 |
Source: Public Records
Tax History Compared to Growth
Tax History
| Year | Tax Paid | Tax Assessment Tax Assessment Total Assessment is a certain percentage of the fair market value that is determined by local assessors to be the total taxable value of land and additions on the property. | Land | Improvement |
|---|---|---|---|---|
| 2024 | $3,229 | $112,600 | $16,850 | $95,750 |
| 2023 | $3,075 | $106,250 | $16,850 | $89,400 |
| 2022 | $3,049 | $100,800 | $16,850 | $83,950 |
| 2021 | $2,849 | $90,450 | $14,300 | $76,150 |
| 2020 | $2,687 | $89,050 | $14,300 | $74,750 |
| 2019 | $2,489 | $88,600 | $14,300 | $74,300 |
| 2018 | $2,361 | $87,850 | $14,300 | $73,550 |
| 2017 | $2,233 | $85,150 | $14,300 | $70,850 |
| 2016 | $1,962 | $82,300 | $14,300 | $68,000 |
| 2015 | $1,973 | $76,250 | $6,950 | $69,300 |
| 2014 | $2,932 | $71,250 | $6,950 | $64,300 |
| 2013 | $2,911 | $68,000 | $6,150 | $61,850 |
Source: Public Records
Map
Nearby Homes
- 729 13 1/2 Ave E
- 731 13 1 2 Ave S
- 725 13 1/2 Ave E
- 725 13 1 2 Ave S
- 731 13 1/2 Ave E
- 723 13 1/2 Ave E
- 735 13 1/2 Ave E
- 735 13 1 2 Ave S
- 719 13 1/2 Ave E
- 737 13 1 2 Ave S
- 719 13 1 2 Ave S
- 730 14th Ave E
- 737 13 1/2 Ave E
- 732 14th Ave E
- 726 14th Ave E
- 724 14th Ave E
- 736 14th Ave E
- 741 13 1 2 Ave S
- 717 13 1 2 Ave E
- 717 13 1/2 Ave E