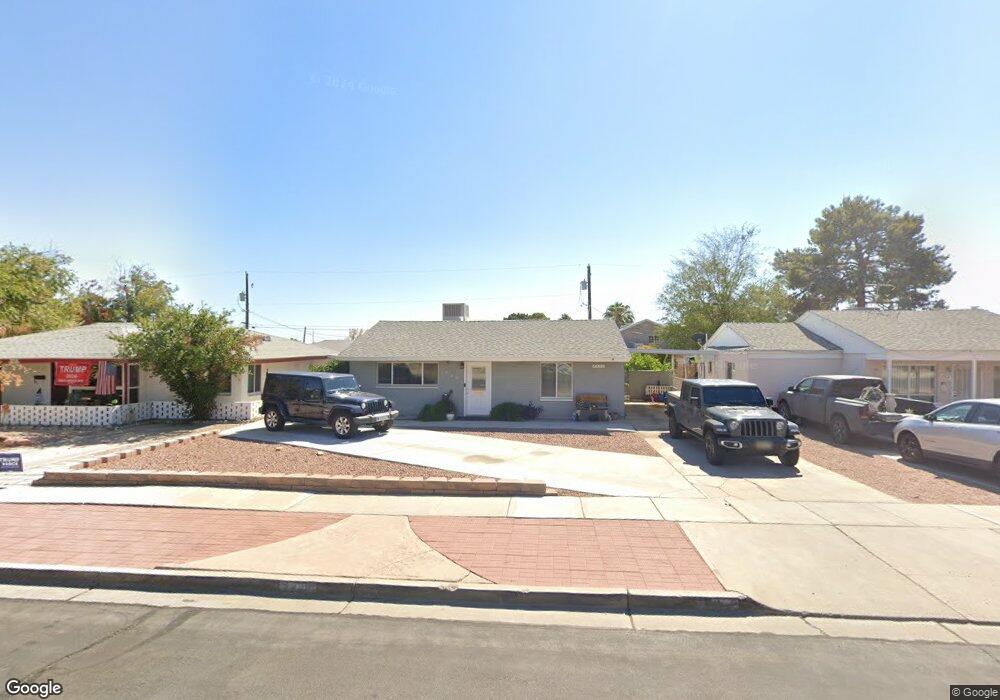
729 7th St Boulder City, NV 89005
Estimated Value: $418,532 - $463,000
3
Beds
2
Baths
1,599
Sq Ft
$272/Sq Ft
Est. Value
About This Home
This home is located at 729 7th St, Boulder City, NV 89005 and is currently estimated at $435,633, approximately $272 per square foot. 729 7th St is a home located in Clark County with nearby schools including Andrew Mitchell Elementary School, Martha P. King Elementary School, and Elton M. & Madelaine E. Garrett Junior High School.
Ownership History
Date
Name
Owned For
Owner Type
Purchase Details
Closed on
Apr 9, 2022
Sold by
Lopan Family Trust
Bought by
Lopan Family Trust
Current Estimated Value
Home Financials for this Owner
Home Financials are based on the most recent Mortgage that was taken out on this home.
Original Mortgage
$538,500
Outstanding Balance
$534,776
Interest Rate
3.6%
Mortgage Type
FHA
Estimated Equity
-$99,143
Purchase Details
Closed on
Jun 19, 2019
Sold by
Lopan Larry S and Lopan Shirlee K
Bought by
Lopan Larry S and Lopan Shirlee K
Home Financials for this Owner
Home Financials are based on the most recent Mortgage that was taken out on this home.
Original Mortgage
$388,500
Interest Rate
4.49%
Mortgage Type
FHA
Purchase Details
Closed on
Jul 13, 2011
Sold by
Lopan Larry S and Lopan Shirlee K
Bought by
Lopan Family Trust
Create a Home Valuation Report for This Property
The Home Valuation Report is an in-depth analysis detailing your home's value as well as a comparison with similar homes in the area
Home Values in the Area
Average Home Value in this Area
Purchase History
| Date | Buyer | Sale Price | Title Company |
|---|---|---|---|
| Lopan Family Trust | -- | New Title Company Name | |
| Lopan Larry S | -- | Lawyers Title Of Nevada C | |
| Lopan Family Trust | -- | None Available |
Source: Public Records
Mortgage History
| Date | Status | Borrower | Loan Amount |
|---|---|---|---|
| Open | Lopan Family Trust | $538,500 | |
| Previous Owner | Lopan Family Trust | $538,500 | |
| Previous Owner | Lopan Larry S | $388,500 |
Source: Public Records
Tax History Compared to Growth
Tax History
| Year | Tax Paid | Tax Assessment Tax Assessment Total Assessment is a certain percentage of the fair market value that is determined by local assessors to be the total taxable value of land and additions on the property. | Land | Improvement |
|---|---|---|---|---|
| 2025 | $1,094 | $69,760 | $49,000 | $20,760 |
| 2024 | $1,013 | $69,760 | $49,000 | $20,760 |
| 2023 | $1,013 | $55,478 | $36,750 | $18,728 |
| 2022 | $938 | $50,026 | $33,250 | $16,776 |
| 2021 | $869 | $46,086 | $30,450 | $15,636 |
| 2020 | $843 | $43,897 | $28,700 | $15,197 |
| 2019 | $819 | $40,856 | $26,250 | $14,606 |
| 2018 | $795 | $36,458 | $22,750 | $13,708 |
| 2017 | $903 | $34,583 | $21,000 | $13,583 |
| 2016 | $752 | $28,973 | $15,750 | $13,223 |
| 2015 | $751 | $28,572 | $15,750 | $12,822 |
| 2014 | $736 | $28,423 | $15,750 | $12,673 |
Source: Public Records
Map
Nearby Homes