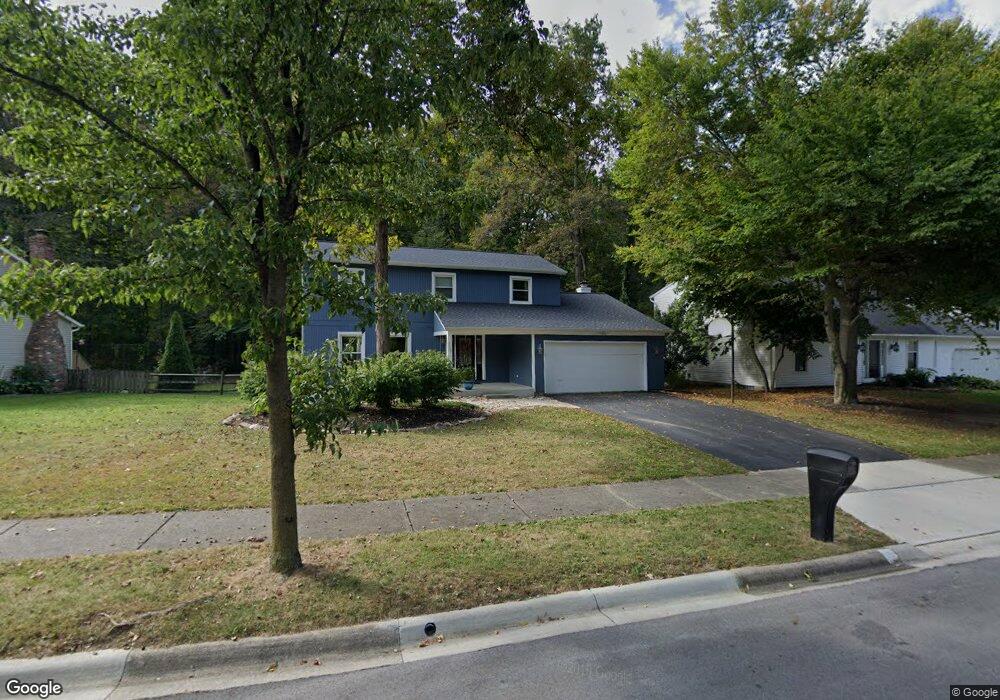
729 Autumn Branch Rd Westerville, OH 43081
Estimated Value: $410,000 - $448,000
4
Beds
3
Baths
1,488
Sq Ft
$288/Sq Ft
Est. Value
About This Home
This home is located at 729 Autumn Branch Rd, Westerville, OH 43081 and is currently estimated at $428,287, approximately $287 per square foot. 729 Autumn Branch Rd is a home located in Franklin County with nearby schools including Mcvay Elementary School, Walnut Springs Middle School, and Westerville-North High School.
Ownership History
Date
Name
Owned For
Owner Type
Purchase Details
Closed on
Mar 1, 2011
Sold by
Deutsche Bank National Trust Company
Bought by
Blackledge Kathleen M
Current Estimated Value
Home Financials for this Owner
Home Financials are based on the most recent Mortgage that was taken out on this home.
Original Mortgage
$136,350
Outstanding Balance
$94,038
Interest Rate
4.87%
Mortgage Type
FHA
Estimated Equity
$334,249
Purchase Details
Closed on
Sep 29, 2010
Sold by
Soller Willam E and Soller Teresa L
Bought by
Deutsche Bank National Trust Company
Purchase Details
Closed on
Apr 18, 1994
Bought by
Soller William E
Purchase Details
Closed on
May 30, 1989
Purchase Details
Closed on
Jun 1, 1987
Create a Home Valuation Report for This Property
The Home Valuation Report is an in-depth analysis detailing your home's value as well as a comparison with similar homes in the area
Home Values in the Area
Average Home Value in this Area
Purchase History
| Date | Buyer | Sale Price | Title Company |
|---|---|---|---|
| Blackledge Kathleen M | $133,000 | Accutitel Agency Inc | |
| Deutsche Bank National Trust Company | $145,334 | None Available | |
| Soller William E | $128,500 | -- | |
| -- | $124,700 | -- | |
| -- | $135,900 | -- |
Source: Public Records
Mortgage History
| Date | Status | Borrower | Loan Amount |
|---|---|---|---|
| Open | Blackledge Kathleen M | $136,350 |
Source: Public Records
Tax History Compared to Growth
Tax History
| Year | Tax Paid | Tax Assessment Tax Assessment Total Assessment is a certain percentage of the fair market value that is determined by local assessors to be the total taxable value of land and additions on the property. | Land | Improvement |
|---|---|---|---|---|
| 2024 | $6,761 | $118,970 | $33,250 | $85,720 |
| 2023 | $6,618 | $118,965 | $33,250 | $85,715 |
| 2022 | $6,151 | $84,430 | $24,260 | $60,170 |
| 2021 | $6,203 | $84,430 | $24,260 | $60,170 |
| 2020 | $6,185 | $84,430 | $24,260 | $60,170 |
| 2019 | $5,430 | $69,970 | $20,230 | $49,740 |
| 2018 | $5,151 | $69,970 | $20,230 | $49,740 |
| 2017 | $5,340 | $69,970 | $20,230 | $49,740 |
| 2016 | $5,141 | $61,320 | $20,160 | $41,160 |
| 2015 | $4,979 | $61,320 | $20,160 | $41,160 |
| 2014 | $4,983 | $61,320 | $20,160 | $41,160 |
| 2013 | $2,370 | $58,415 | $19,215 | $39,200 |
Source: Public Records
Map
Nearby Homes
- 737 Autumn Branch Rd
- 750 Autumn Branch Rd
- 994 Autumn Lake Ct
- 1003 Autumn Meadows Dr
- 1146 Forest Rise Dr
- 1209 Chatham Ridge Rd
- 613 Valley Wood Ct
- 640 Brook Run Dr
- 800 S Spring Rd
- 1368 Nutmeg Ct
- 969 Farrington Dr
- 806 Watten Ln
- 6874 Flatlands Rd
- 1015 Swanton Ct
- 1019 Swanton Ct
- 539 Cherrington Rd
- 326 Peachtree Ct Unit 326D
- 5769 Burntwood Way
- 6506 Purplefinch Ct
- 693 Pointview Dr
- 721 Autumn Branch Rd
- 728 Autumn Branch Rd
- 747 Autumn Branch Rd
- 720 Autumn Branch Rd
- 734 Autumn Branch Rd
- 742 Autumn Branch Rd
- 755 Autumn Branch Rd
- 705 Autumn Branch Rd
- 1057 Autumn Woods Dr
- 1065 Autumn Woods Dr
- 1049 Autumn Woods Dr
- 758 Autumn Branch Rd
- 1073 Autumn Woods Dr
- 1039 Autumn Woods Dr
- 699 Autumn Branch Rd
- 763 Autumn Branch Rd
- 1175 Autumn Creek Cir
- 766 Autumn Branch Rd
- 691 Autumn Branch Rd
- 1183 Autumn Creek Cir