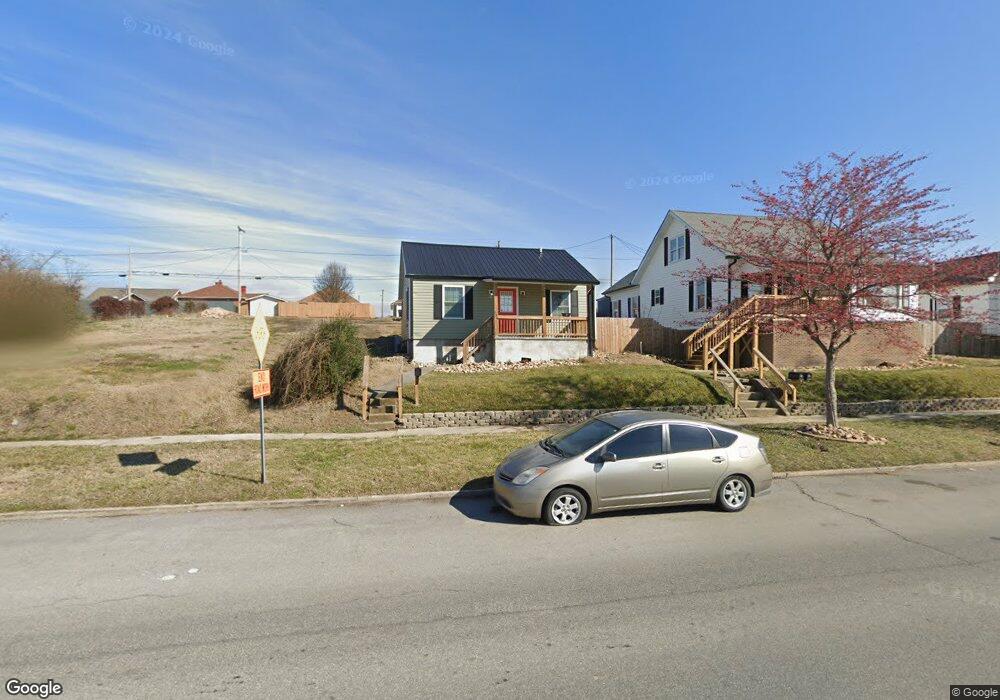
729 E Sullivan St Kingsport, TN 37660
Estimated Value: $94,000 - $184,000
--
Bed
1
Bath
960
Sq Ft
$139/Sq Ft
Est. Value
About This Home
This home is located at 729 E Sullivan St, Kingsport, TN 37660 and is currently estimated at $133,333, approximately $138 per square foot. 729 E Sullivan St is a home located in Sullivan County with nearby schools including Abraham Lincoln Elementary School, John Sevier Middle School, and Ross N. Robinson Middle School.
Ownership History
Date
Name
Owned For
Owner Type
Purchase Details
Closed on
Jul 18, 2022
Sold by
Robert Brents
Bought by
Stiltner Jeremy and Stiltner Elizabeth
Current Estimated Value
Home Financials for this Owner
Home Financials are based on the most recent Mortgage that was taken out on this home.
Original Mortgage
$648,150
Outstanding Balance
$478,162
Interest Rate
5.23%
Mortgage Type
New Conventional
Estimated Equity
-$344,829
Purchase Details
Closed on
Feb 12, 2020
Sold by
Brents Arielle
Bought by
Brents Robert
Purchase Details
Closed on
Nov 28, 2007
Sold by
Lane Monica J
Bought by
Jeff Lane
Purchase Details
Closed on
May 11, 2004
Sold by
Scott Dishner D
Bought by
Jeff Lane
Purchase Details
Closed on
Jun 29, 2001
Sold by
Mary Johnson
Bought by
Scott Dishner
Home Financials for this Owner
Home Financials are based on the most recent Mortgage that was taken out on this home.
Original Mortgage
$21,200
Interest Rate
7.05%
Create a Home Valuation Report for This Property
The Home Valuation Report is an in-depth analysis detailing your home's value as well as a comparison with similar homes in the area
Home Values in the Area
Average Home Value in this Area
Purchase History
| Date | Buyer | Sale Price | Title Company |
|---|---|---|---|
| Stiltner Jeremy | $745,000 | Scott Timothy E | |
| Brents Robert | -- | None Available | |
| Jeff Lane | -- | -- | |
| Jeff Lane | $26,500 | -- | |
| Scott Dishner | $10,000 | -- |
Source: Public Records
Mortgage History
| Date | Status | Borrower | Loan Amount |
|---|---|---|---|
| Open | Stiltner Jeremy | $648,150 | |
| Previous Owner | Scott Dishner | $21,200 |
Source: Public Records
Tax History Compared to Growth
Tax History
| Year | Tax Paid | Tax Assessment Tax Assessment Total Assessment is a certain percentage of the fair market value that is determined by local assessors to be the total taxable value of land and additions on the property. | Land | Improvement |
|---|---|---|---|---|
| 2024 | -- | $20,350 | $2,475 | $17,875 |
| 2023 | $897 | $20,350 | $2,475 | $17,875 |
| 2022 | $897 | $20,350 | $2,475 | $17,875 |
| 2021 | $564 | $13,175 | $2,475 | $10,700 |
| 2020 | $305 | $13,175 | $2,475 | $10,700 |
| 2019 | $550 | $11,875 | $2,475 | $9,400 |
| 2018 | $538 | $11,875 | $2,475 | $9,400 |
| 2017 | $635 | $14,025 | $2,475 | $11,550 |
| 2016 | $415 | $8,925 | $1,350 | $7,575 |
| 2014 | $390 | $8,921 | $0 | $0 |
Source: Public Records
Map
Nearby Homes
- 917 E Sullivan St
- 746 Myrtle St
- 1005 Maple St
- 1006 Myrtle St
- 605 Myrtle St
- 513 Granada Pvt Ct
- 809 Yadkin St
- 813 Watauga St
- 1005 Yadkin St
- 801 Watauga St
- 809 Birch St
- 214 Commerce St Unit B
- 2066 Dr
- 2054 Brickyard Park Dr
- 1122 Catawba St
- 1234 E Center St
- 924 Campbell St
- 146 E Park Dr
- 1246 E Center St
- 1432 Valley St