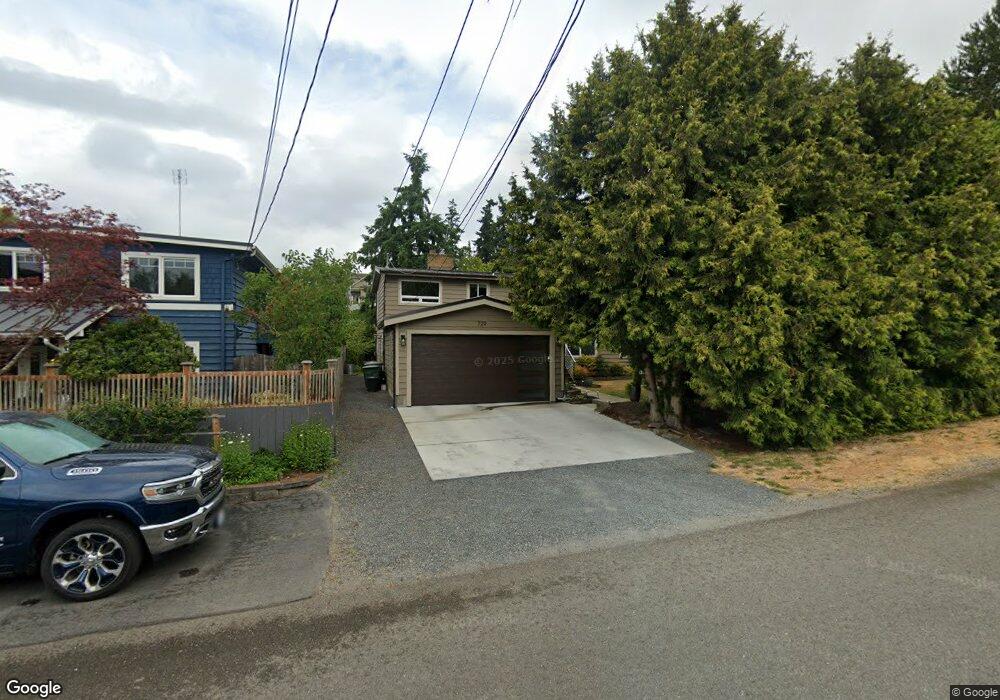
729 Edmonds St Edmonds, WA 98020
Edmonds Bowl NeighborhoodEstimated Value: $970,000 - $1,329,000
3
Beds
3
Baths
2,496
Sq Ft
$450/Sq Ft
Est. Value
About This Home
This home is located at 729 Edmonds St, Edmonds, WA 98020 and is currently estimated at $1,122,749, approximately $449 per square foot. 729 Edmonds St is a home located in Snohomish County with nearby schools including Edmonds Elementary School, College Place Middle School, and Edmonds-Woodway High School.
Ownership History
Date
Name
Owned For
Owner Type
Purchase Details
Closed on
Nov 11, 2024
Sold by
Whitney Donald Edward
Bought by
Whitney Beth M
Current Estimated Value
Purchase Details
Closed on
Jun 17, 2003
Sold by
Whitney Donald Edward
Bought by
Whitney Donald E and Whitney Beth M
Home Financials for this Owner
Home Financials are based on the most recent Mortgage that was taken out on this home.
Original Mortgage
$264,000
Interest Rate
5.53%
Mortgage Type
Purchase Money Mortgage
Purchase Details
Closed on
Mar 14, 1995
Sold by
Robert L & E Helen Olsen Living Trust
Bought by
Whitney Donald Edward
Home Financials for this Owner
Home Financials are based on the most recent Mortgage that was taken out on this home.
Original Mortgage
$160,000
Interest Rate
9.03%
Mortgage Type
Seller Take Back
Create a Home Valuation Report for This Property
The Home Valuation Report is an in-depth analysis detailing your home's value as well as a comparison with similar homes in the area
Home Values in the Area
Average Home Value in this Area
Purchase History
| Date | Buyer | Sale Price | Title Company |
|---|---|---|---|
| Whitney Beth M | $313 | None Listed On Document | |
| Whitney Beth M | $313 | None Listed On Document | |
| Whitney Donald E | -- | Chicago Title Insurance Co | |
| Whitney Donald Edward | $170,000 | Chicago Title Insurance Co |
Source: Public Records
Mortgage History
| Date | Status | Borrower | Loan Amount |
|---|---|---|---|
| Previous Owner | Whitney Donald E | $264,000 | |
| Previous Owner | Whitney Donald Edward | $160,000 |
Source: Public Records
Tax History Compared to Growth
Tax History
| Year | Tax Paid | Tax Assessment Tax Assessment Total Assessment is a certain percentage of the fair market value that is determined by local assessors to be the total taxable value of land and additions on the property. | Land | Improvement |
|---|---|---|---|---|
| 2025 | $7,277 | $1,025,100 | $768,300 | $256,800 |
| 2024 | $7,081 | $995,200 | $740,900 | $254,300 |
| 2023 | $6,894 | $1,004,100 | $705,600 | $298,500 |
| 2022 | $6,763 | $809,800 | $557,100 | $252,700 |
| 2020 | $6,331 | $678,000 | $455,700 | $222,300 |
| 2019 | $5,778 | $623,200 | $411,100 | $212,100 |
| 2018 | $5,898 | $549,700 | $359,900 | $189,800 |
| 2017 | $5,129 | $500,100 | $325,500 | $174,600 |
| 2016 | $4,756 | $459,500 | $292,000 | $167,500 |
| 2015 | $4,875 | $443,400 | $265,100 | $178,300 |
| 2013 | $3,759 | $322,500 | $175,800 | $146,700 |
Source: Public Records
Map
Nearby Homes
- 621 Daley St
- 603 7th Ave N Unit A306
- 609 7th Ave N Unit B204
- 302 6th Ave S
- 816 Walnut St
- 625 Aloha Way
- 611 3rd Ave N
- 1021 Walnut St
- 233 3rd Ave S Unit 304
- 335 3rd Ave S Unit 203
- 9533 Bowdoin Way
- 404 3rd Ave S Unit A201
- 960 5th Ave S Unit 208
- 21232 92nd Place W
- 1414 9th Ave N Unit 105
- 21703 97th Ave W
- 1071 4th Ave S Unit 302
- 1110 5th Ave S Unit 204
- 1030 Grandview St
- 1514 9th Ave N