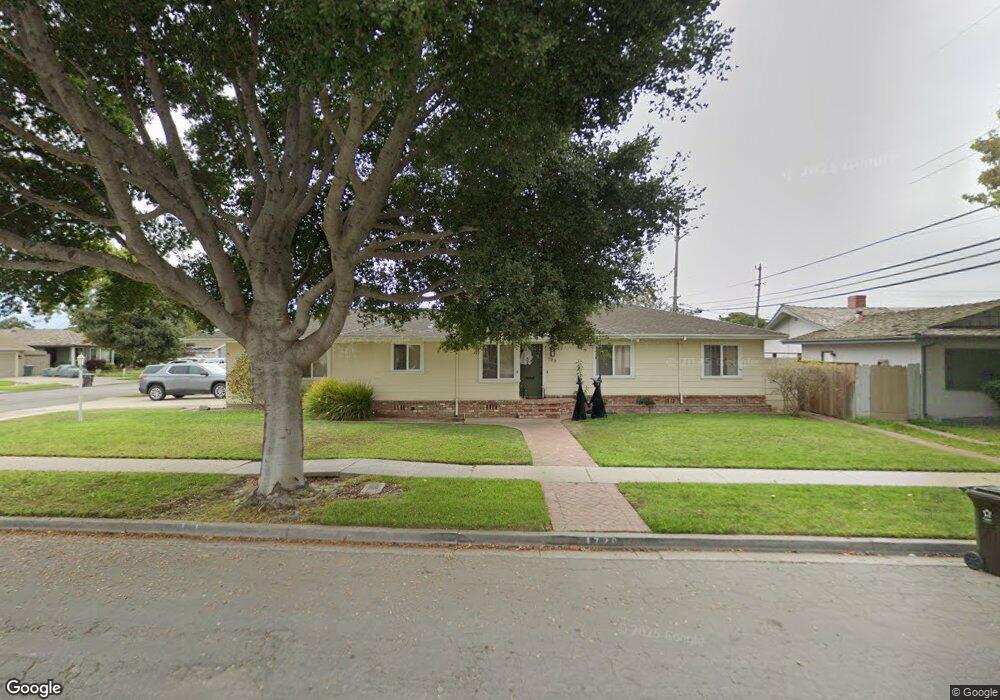
729 Fairfax Dr Salinas, CA 93901
South Salinas NeighborhoodEstimated Value: $675,000 - $758,000
3
Beds
2
Baths
1,334
Sq Ft
$532/Sq Ft
Est. Value
About This Home
This home is located at 729 Fairfax Dr, Salinas, CA 93901 and is currently estimated at $709,161, approximately $531 per square foot. 729 Fairfax Dr is a home located in Monterey County with nearby schools including Roosevelt Elementary School, Laurel Wood Elementary School, and Washington Middle School.
Ownership History
Date
Name
Owned For
Owner Type
Purchase Details
Closed on
May 11, 2010
Sold by
Guerra Marco A and Guerra Tiffanie M
Bought by
Weiss Marilyn M and Weiss Helmut F
Current Estimated Value
Home Financials for this Owner
Home Financials are based on the most recent Mortgage that was taken out on this home.
Original Mortgage
$238,598
Outstanding Balance
$158,506
Interest Rate
4.87%
Mortgage Type
FHA
Estimated Equity
$550,655
Purchase Details
Closed on
Apr 23, 2003
Sold by
Guerra Marco A
Bought by
Guerra Marco A and Guerra Tiffanie M
Home Financials for this Owner
Home Financials are based on the most recent Mortgage that was taken out on this home.
Original Mortgage
$157,000
Interest Rate
5.72%
Mortgage Type
Stand Alone First
Purchase Details
Closed on
Jan 27, 2000
Sold by
Machado Alvin John
Bought by
Guerra Marco A
Home Financials for this Owner
Home Financials are based on the most recent Mortgage that was taken out on this home.
Original Mortgage
$146,000
Interest Rate
7.87%
Mortgage Type
Stand Alone First
Create a Home Valuation Report for This Property
The Home Valuation Report is an in-depth analysis detailing your home's value as well as a comparison with similar homes in the area
Home Values in the Area
Average Home Value in this Area
Purchase History
| Date | Buyer | Sale Price | Title Company |
|---|---|---|---|
| Weiss Marilyn M | $243,000 | Lawyers Title Sd | |
| Guerra Marco A | -- | First American Title | |
| Guerra Marco A | $182,500 | First American Title |
Source: Public Records
Mortgage History
| Date | Status | Borrower | Loan Amount |
|---|---|---|---|
| Open | Weiss Marilyn M | $238,598 | |
| Previous Owner | Guerra Marco A | $157,000 | |
| Previous Owner | Guerra Marco A | $146,000 |
Source: Public Records
Tax History
| Year | Tax Paid | Tax Assessment Tax Assessment Total Assessment is a certain percentage of the fair market value that is determined by local assessors to be the total taxable value of land and additions on the property. | Land | Improvement |
|---|---|---|---|---|
| 2025 | $6,083 | $478,880 | $206,678 | $272,202 |
| 2024 | $6,083 | $469,491 | $202,626 | $266,865 |
| 2023 | $5,408 | $469,491 | $202,626 | $266,865 |
| 2022 | $3,359 | $295,568 | $97,305 | $198,263 |
| 2021 | $3,677 | $289,774 | $95,398 | $194,376 |
| 2020 | $3,368 | $286,803 | $94,420 | $192,383 |
| 2019 | $3,548 | $281,180 | $92,569 | $188,611 |
| 2018 | $3,075 | $275,667 | $90,754 | $184,913 |
| 2017 | $3,078 | $270,263 | $88,975 | $181,288 |
| 2016 | $3,080 | $264,965 | $87,231 | $177,734 |
| 2015 | $3,107 | $260,986 | $85,921 | $175,065 |
| 2014 | $2,899 | $255,874 | $84,238 | $171,636 |
Source: Public Records
Map
Nearby Homes
- 730 Lemos Ave
- 767 Lemos Ave
- 612 Central Ave
- 606 Central Ave
- 826 Central Ave
- 1130 Montecito Cir
- 840 Hastings Ave
- 30 Santa Monica Ct
- 961 Loyola Dr
- 551 San Felipe St
- 307 W Alisal St
- 89 Clark St
- 1223 La Canada Way
- 330 Woodside Dr Unit 105
- 1051 Riker St Unit 7
- 1053 Riker St Unit 6
- 23 Capitol St
- 138 Nissen Rd Unit 1
- 134 Nissen Rd Unit 2
- 132 Nissen Rd Unit 3
- 810 Bel Air Way
- 735 Fairfax Dr
- 739 Fairfax Dr
- 18 Chalon Cir
- 732 Fairfax Dr
- 807 Bel Air Way
- 728 Fairfax Dr
- 814 Bel Air Way
- 736 Fairfax Dr
- 724 Fairfax Dr
- 14 Chalon Cir
- 811 Bel Air Way
- 740 Fairfax Dr
- 717 Fairfax Dr
- 720 Fairfax Dr
- 818 Bel Air Way
- 815 Bel Air Way
- 737 Lemos Ave
- 10 Chalon Cir
- 733 Lemos Ave
Your Personal Tour Guide
Ask me questions while you tour the home.