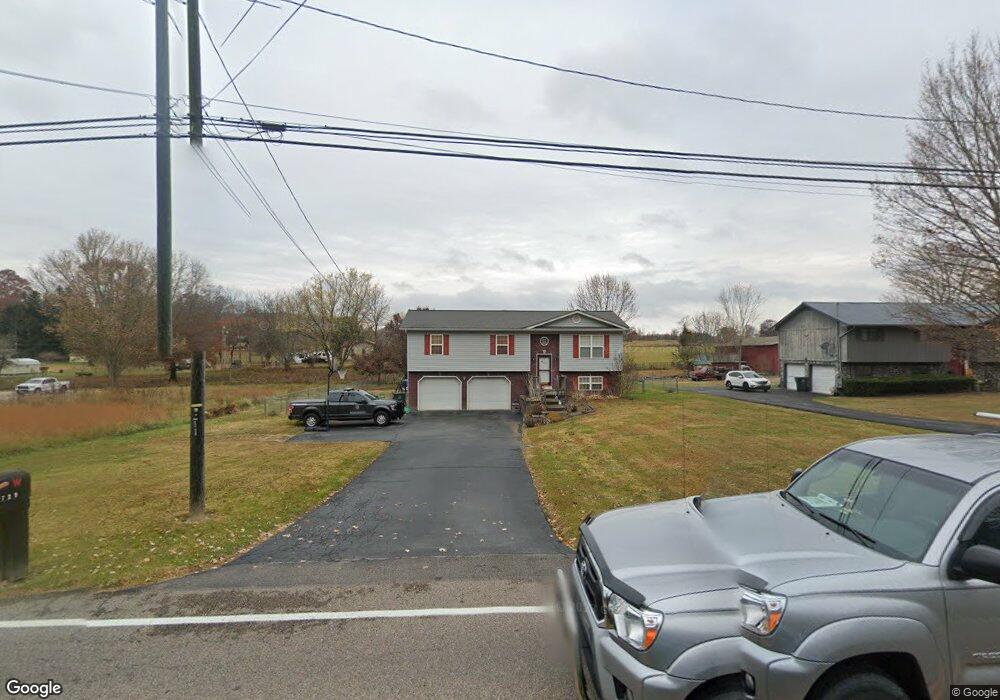
729 Gray Station Sulphur Springs Rd Jonesborough, TN 37659
Estimated Value: $338,000 - $349,514
--
Bed
3
Baths
1,189
Sq Ft
$287/Sq Ft
Est. Value
About This Home
This home is located at 729 Gray Station Sulphur Springs Rd, Jonesborough, TN 37659 and is currently estimated at $341,629, approximately $287 per square foot. 729 Gray Station Sulphur Springs Rd is a home located in Washington County with nearby schools including Ridgeview Elementary School, Daniel Boone High School, and Tri City Seventh-day Adventist School.
Ownership History
Date
Name
Owned For
Owner Type
Purchase Details
Closed on
Apr 9, 2014
Sold by
Starnes Scott A
Bought by
Weaver Todd A and Weaver Nancy P
Current Estimated Value
Home Financials for this Owner
Home Financials are based on the most recent Mortgage that was taken out on this home.
Original Mortgage
$135,500
Outstanding Balance
$102,655
Interest Rate
4.25%
Mortgage Type
FHA
Estimated Equity
$238,974
Purchase Details
Closed on
May 5, 2008
Sold by
Garland Brett V
Bought by
Starnes Scott A
Home Financials for this Owner
Home Financials are based on the most recent Mortgage that was taken out on this home.
Original Mortgage
$159,000
Interest Rate
5.86%
Purchase Details
Closed on
Jun 23, 2004
Sold by
Plante Peter E
Bought by
Garland Brett V
Purchase Details
Closed on
Sep 10, 1996
Bought by
Plante Peter E
Purchase Details
Closed on
Nov 22, 1995
Bought by
Larimer Curtis
Purchase Details
Closed on
Dec 21, 1981
Bought by
Broyles Russ and Broyles Peggy
Create a Home Valuation Report for This Property
The Home Valuation Report is an in-depth analysis detailing your home's value as well as a comparison with similar homes in the area
Home Values in the Area
Average Home Value in this Area
Purchase History
| Date | Buyer | Sale Price | Title Company |
|---|---|---|---|
| Weaver Todd A | $138,000 | -- | |
| Starnes Scott A | $161,500 | -- | |
| Garland Brett V | $116,500 | -- | |
| Plante Peter E | $93,500 | -- | |
| Larimer Curtis | $10,000 | -- | |
| Broyles Russ | $7,000 | -- |
Source: Public Records
Mortgage History
| Date | Status | Borrower | Loan Amount |
|---|---|---|---|
| Open | Weaver Todd A | $135,500 | |
| Previous Owner | Broyles Russ | $159,000 |
Source: Public Records
Tax History Compared to Growth
Tax History
| Year | Tax Paid | Tax Assessment Tax Assessment Total Assessment is a certain percentage of the fair market value that is determined by local assessors to be the total taxable value of land and additions on the property. | Land | Improvement |
|---|---|---|---|---|
| 2024 | $974 | $56,950 | $10,000 | $46,950 |
| 2022 | $779 | $36,225 | $8,750 | $27,475 |
| 2021 | $779 | $36,225 | $8,750 | $27,475 |
| 2020 | $779 | $36,225 | $8,750 | $27,475 |
| 2019 | $787 | $36,225 | $8,750 | $27,475 |
| 2018 | $787 | $33,050 | $5,625 | $27,425 |
| 2017 | $787 | $33,050 | $5,625 | $27,425 |
| 2016 | $787 | $33,050 | $5,625 | $27,425 |
| 2015 | $654 | $33,050 | $5,625 | $27,425 |
| 2014 | $654 | $33,050 | $5,625 | $27,425 |
Source: Public Records
Map
Nearby Homes
- 142 Laurel Acres Ct
- 352 Dean Archer Rd
- 368 Moore Rd
- Lot 38 Dean Archer Rd
- 1040 Bovine Ranch
- 110 Paul Saylor Rd
- 124 Leedy Ln
- 2111 Cattlemans Trail
- 190 Highland Rd
- 248 Dean Archer Rd
- 656 Uncle Buddys Way
- Lot 26 Cattleman's Trail
- Lot 52 Uncle Buddys Way
- Lot 50 Uncle Buddys Way
- Lot 49 Uncle Buddys Way
- Lot 28 Cattleman's Trail
- Lot 27 Cattleman's Trail
- Lot 16 Cattleman's Trail
- 2266 Cattlemans Trail
- 130 Hillview Ct
- 729 Gray Station Sulphur Springs Rd
- 725 Gray Station Sulphur Springs Rd
- 725 Gy Sta Slphr Spg Rd
- 721 Gray Sta-Sul Springs Rd
- 721 Gy Sta Slphr Spg Rd
- 735 Gy Sta Slphr Spg Rd
- 721 Gray Station Sulphur Springs Rd
- 735 Gray Sta-Sul Springs Rd
- 735 Gray Station Sulphur Springs Rd
- 713 Gray Station Sulphur Springs Rd
- 713 Gray Station Sulphur Springs Rd
- 713 Gray Station Sulphur Springs Rd
- 741 Gray Station Sulphur Springs Rd
- 728 Gray Station Sulphur Springs Rd
- 110 Elm Hill Dr
- 705 Gray Station Sulphur Springs Rd
- 730 Gray Station Sulphur Springs Rd
- 732 Gray Station Sulphur Springs Rd
- 732 Gray Station Sulphur Springs Rd
- 703 Gray Station Sulphur Springs Rd