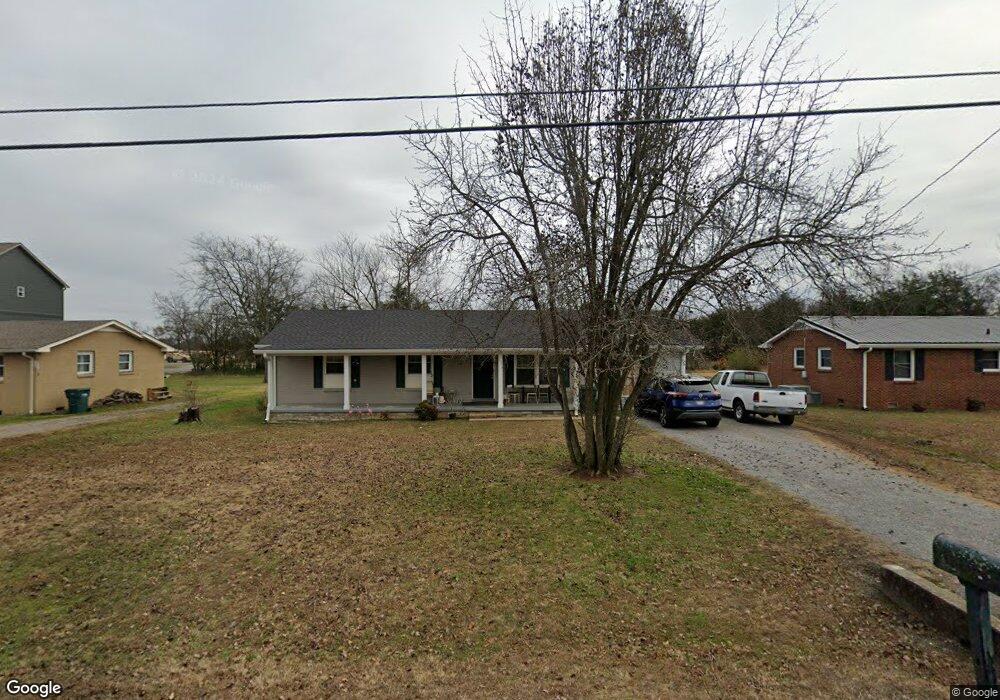
729 Kent Dr Lebanon, TN 37087
Estimated Value: $256,000 - $323,000
--
Bed
1
Bath
1,475
Sq Ft
$200/Sq Ft
Est. Value
About This Home
This home is located at 729 Kent Dr, Lebanon, TN 37087 and is currently estimated at $295,127, approximately $200 per square foot. 729 Kent Dr is a home located in Wilson County with nearby schools including Byars Dowdy Elementary School, Winfree Bryant Middle School, and Lebanon High School.
Ownership History
Date
Name
Owned For
Owner Type
Purchase Details
Closed on
Oct 17, 2014
Sold by
Martin John
Bought by
Tarpley James R and Tarpley Carolyn L
Current Estimated Value
Purchase Details
Closed on
Aug 30, 2010
Sold by
Wells Fargo Bank Na
Bought by
Martin John
Purchase Details
Closed on
Oct 2, 2009
Sold by
Jones Charles J
Bought by
Wells Fargo Bank Na
Purchase Details
Closed on
Aug 10, 2007
Sold by
Jones Charles J
Bought by
Calexico Properties Llc
Purchase Details
Closed on
Nov 14, 2005
Bought by
Jones Charles J
Home Financials for this Owner
Home Financials are based on the most recent Mortgage that was taken out on this home.
Original Mortgage
$108,000
Interest Rate
6%
Purchase Details
Closed on
May 21, 1999
Bought by
Blum David and Blum Michelle
Purchase Details
Closed on
May 13, 1998
Sold by
Howard Foster
Bought by
Frank Lannom
Purchase Details
Closed on
Jun 27, 1997
Sold by
Hix Michael D
Bought by
Howard Foster
Purchase Details
Closed on
Apr 13, 1990
Bought by
King Ronald E
Purchase Details
Closed on
Mar 10, 1977
Bought by
Gwynn James R and Gwynn Emma
Create a Home Valuation Report for This Property
The Home Valuation Report is an in-depth analysis detailing your home's value as well as a comparison with similar homes in the area
Home Values in the Area
Average Home Value in this Area
Purchase History
| Date | Buyer | Sale Price | Title Company |
|---|---|---|---|
| Tarpley James R | $105,000 | -- | |
| Martin John | $68,500 | -- | |
| Wells Fargo Bank Na | $109,800 | -- | |
| Calexico Properties Llc | -- | -- | |
| Jones Charles J | $120,000 | -- | |
| Blum David | $79,000 | -- | |
| Frank Lannom | $60,500 | -- | |
| Howard Foster | $72,000 | -- | |
| King Ronald E | -- | -- | |
| Gwynn James R | -- | -- |
Source: Public Records
Mortgage History
| Date | Status | Borrower | Loan Amount |
|---|---|---|---|
| Previous Owner | Gwynn James R | $108,000 |
Source: Public Records
Tax History Compared to Growth
Tax History
| Year | Tax Paid | Tax Assessment Tax Assessment Total Assessment is a certain percentage of the fair market value that is determined by local assessors to be the total taxable value of land and additions on the property. | Land | Improvement |
|---|---|---|---|---|
| 2024 | $906 | $41,050 | $11,250 | $29,800 |
| 2022 | $1,187 | $41,050 | $11,250 | $29,800 |
| 2021 | $1,187 | $41,050 | $11,250 | $29,800 |
| 2020 | $917 | $41,050 | $11,250 | $29,800 |
| 2019 | $209 | $24,400 | $6,025 | $18,375 |
| 2018 | $856 | $24,400 | $6,025 | $18,375 |
| 2017 | $901 | $25,675 | $6,025 | $19,650 |
| 2016 | $901 | $25,675 | $6,025 | $19,650 |
| 2015 | $931 | $25,675 | $6,025 | $19,650 |
| 2014 | $839 | $23,126 | $0 | $0 |
Source: Public Records
Map
Nearby Homes
- 908 Long Leaf Rd
- 721 Kent Dr
- 719 Kent Dr
- 717 Kent Dr
- 715 Kent Dr
- 713 Kent Dr
- 400 Castlewood Ln
- 319 June Dr
- 715 Fields Ln
- 118 Castlewood Ln
- 200 Castlewood Ln
- 100 Maple View Dr
- 438 Leeville Pike
- 116 Maple View Rd
- 509 B Castle Heights Ave
- 421 Hobbs Ave
- 120 Holloway Dr
- 620 Franklin Rd
- 113 Holloway Dr
- 313 Hobbs Ave