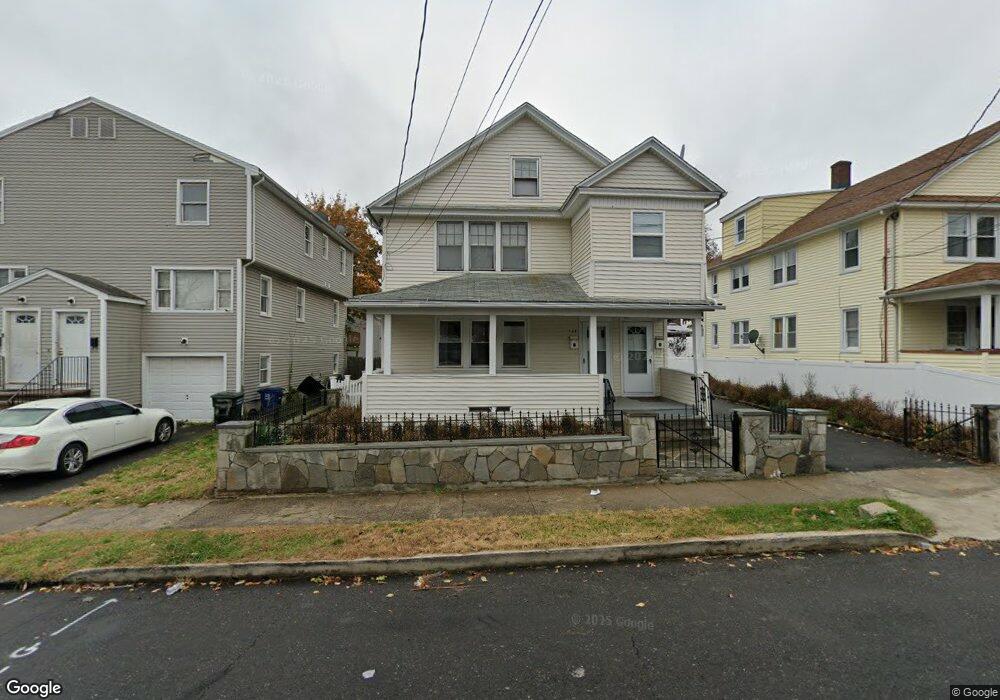
729 Lindley St Unit 731 Bridgeport, CT 06606
Brooklawn-Saint Vincent NeighborhoodEstimated Value: $422,046 - $661,000
2
Beds
1
Bath
1,100
Sq Ft
$500/Sq Ft
Est. Value
About This Home
This home is located at 729 Lindley St Unit 731, Bridgeport, CT 06606 and is currently estimated at $549,762, approximately $499 per square foot. 729 Lindley St Unit 731 is a home located in Fairfield County with nearby schools including Read School, Central High School, and Achievement First Bridgeport Academy Elementary School.
Ownership History
Date
Name
Owned For
Owner Type
Purchase Details
Closed on
Jul 19, 1988
Sold by
Mota Antonio
Bought by
Casares Jose
Current Estimated Value
Home Financials for this Owner
Home Financials are based on the most recent Mortgage that was taken out on this home.
Original Mortgage
$160,000
Interest Rate
10.57%
Mortgage Type
Purchase Money Mortgage
Purchase Details
Closed on
Mar 4, 1988
Sold by
Kobus Casimir
Bought by
Moto Deolindo
Home Financials for this Owner
Home Financials are based on the most recent Mortgage that was taken out on this home.
Original Mortgage
$165,000
Interest Rate
10.35%
Mortgage Type
Purchase Money Mortgage
Create a Home Valuation Report for This Property
The Home Valuation Report is an in-depth analysis detailing your home's value as well as a comparison with similar homes in the area
Home Values in the Area
Average Home Value in this Area
Purchase History
| Date | Buyer | Sale Price | Title Company |
|---|---|---|---|
| Casares Jose | $212,500 | -- | |
| Moto Deolindo | $111,000 | -- |
Source: Public Records
Mortgage History
| Date | Status | Borrower | Loan Amount |
|---|---|---|---|
| Closed | Moto Deolindo | $131,000 | |
| Closed | Moto Deolindo | $139,200 | |
| Closed | Moto Deolindo | $160,000 | |
| Previous Owner | Moto Deolindo | $165,000 |
Source: Public Records
Tax History Compared to Growth
Tax History
| Year | Tax Paid | Tax Assessment Tax Assessment Total Assessment is a certain percentage of the fair market value that is determined by local assessors to be the total taxable value of land and additions on the property. | Land | Improvement |
|---|---|---|---|---|
| 2025 | $7,273 | $167,388 | $60,598 | $106,790 |
| 2024 | $7,273 | $167,388 | $60,598 | $106,790 |
| 2023 | $7,273 | $167,388 | $60,598 | $106,790 |
| 2022 | $7,273 | $167,388 | $60,598 | $106,790 |
| 2021 | $7,273 | $167,388 | $60,598 | $106,790 |
| 2020 | $6,376 | $118,100 | $36,740 | $81,360 |
| 2019 | $6,376 | $118,100 | $36,740 | $81,360 |
| 2018 | $6,421 | $118,100 | $36,740 | $81,360 |
| 2017 | $6,421 | $118,100 | $36,740 | $81,360 |
| 2016 | $6,421 | $118,100 | $36,740 | $81,360 |
| 2015 | $6,463 | $153,160 | $37,040 | $116,120 |
| 2014 | $6,463 | $153,160 | $37,040 | $116,120 |
Source: Public Records
Map
Nearby Homes
- 330 French St
- 936 Lindley St
- 2395 Main St Unit 2397
- 25 Manhattan Ave Unit 27
- 926 Hart St
- 916 Hart St
- 508 Hawley Ave
- 724 Capitol Ave Unit 726
- 39 Infield St
- 106 Manhattan Ave Unit 108
- 119 Madison Terrace
- 178 Island Brook Ave
- 123 Harlem Ave
- 76 Porter St
- 390 Charles St Unit 106
- 1265 Lindley St
- 235 Indian Ave
- 138 Infield St
- 245 Indian Ave
- 203 Wayne St
- 741 Lindley St Unit 3
- 739 Lindley St Unit 741
- 739 Lindley St Unit 1
- 751 Lindley St
- 755 Lindley St
- 759 Lindley St Unit 761
- 698 Lindley St Unit 700
- 700 Lindley St
- 769 Lindley St Unit 771
- 90 Gurdon St
- 696 Lindley St
- 108 Gurdon St Unit 110
- 782 Lindley St
- 118 Gurdon St Unit 120
- 128 Gurdon St Unit 130
- 791 Lindley St Unit 793
- 158 Gurdon St
- 138 Gurdon St Unit 140
- 790 Lindley St
- 699 Lindley St