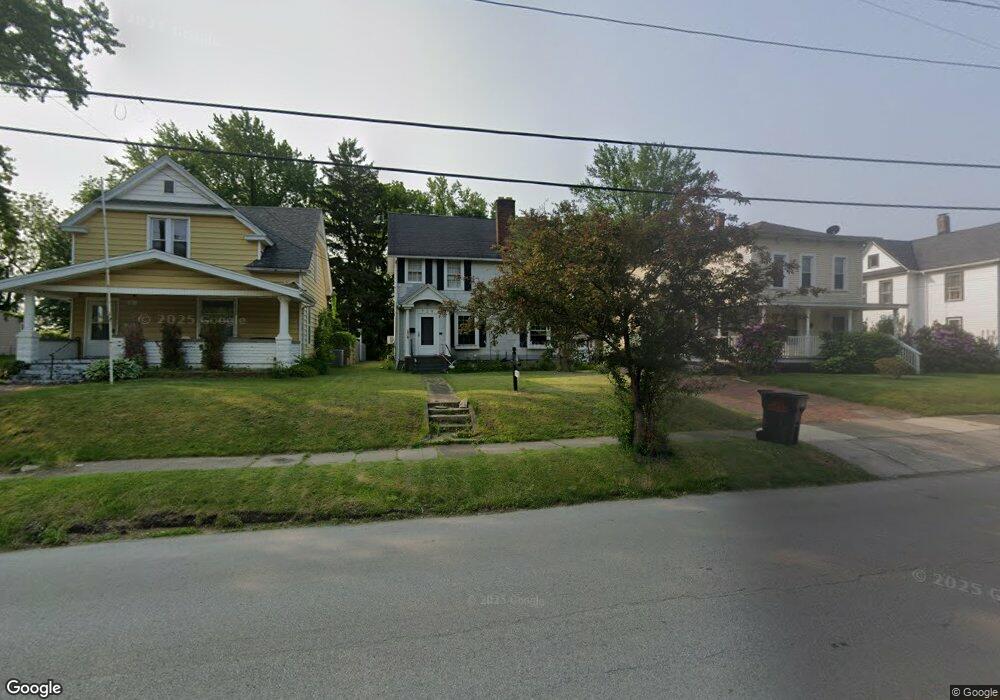
729 Main St Conneaut, OH 44030
Estimated Value: $112,000 - $175,000
3
Beds
2
Baths
1,728
Sq Ft
$81/Sq Ft
Est. Value
About This Home
This home is located at 729 Main St, Conneaut, OH 44030 and is currently estimated at $139,345, approximately $80 per square foot. 729 Main St is a home located in Ashtabula County with nearby schools including Lakeshore Primary Elementary School, Gateway Elementary School, and Conneaut Middle School.
Ownership History
Date
Name
Owned For
Owner Type
Purchase Details
Closed on
Nov 23, 2020
Sold by
Sanford Nicholas A and Sanford Jennifer M
Bought by
Smock Mick
Current Estimated Value
Home Financials for this Owner
Home Financials are based on the most recent Mortgage that was taken out on this home.
Original Mortgage
$83,838
Outstanding Balance
$74,604
Interest Rate
2.8%
Mortgage Type
New Conventional
Estimated Equity
$64,741
Purchase Details
Closed on
Mar 30, 2019
Sold by
Sanford Nicholas A
Bought by
Sanford Nicholas A and Sanford Jennifer M
Purchase Details
Closed on
Oct 13, 2010
Sold by
Wilcox Vicki and Klimek Vicki
Bought by
Sanford Nicholas A
Home Financials for this Owner
Home Financials are based on the most recent Mortgage that was taken out on this home.
Original Mortgage
$63,050
Interest Rate
4.26%
Mortgage Type
New Conventional
Purchase Details
Closed on
Oct 24, 1996
Sold by
Niinisto Matthew E
Bought by
Wilcox David E and Klimek Vicki
Create a Home Valuation Report for This Property
The Home Valuation Report is an in-depth analysis detailing your home's value as well as a comparison with similar homes in the area
Home Values in the Area
Average Home Value in this Area
Purchase History
| Date | Buyer | Sale Price | Title Company |
|---|---|---|---|
| Smock Mick | $83,000 | Title Professionals Group Lt | |
| Sanford Nicholas A | -- | None Available | |
| Sanford Nicholas A | $65,000 | Chicago Title | |
| Wilcox David E | $60,000 | -- |
Source: Public Records
Mortgage History
| Date | Status | Borrower | Loan Amount |
|---|---|---|---|
| Open | Smock Mick | $83,838 | |
| Previous Owner | Sanford Nicholas A | $63,050 |
Source: Public Records
Tax History
| Year | Tax Paid | Tax Assessment Tax Assessment Total Assessment is a certain percentage of the fair market value that is determined by local assessors to be the total taxable value of land and additions on the property. | Land | Improvement |
|---|---|---|---|---|
| 2024 | $1,962 | $26,820 | $2,910 | $23,910 |
| 2023 | $1,249 | $26,820 | $2,910 | $23,910 |
| 2022 | $1,093 | $20,650 | $2,240 | $18,410 |
| 2021 | $1,112 | $20,650 | $2,240 | $18,410 |
| 2020 | $1,111 | $20,650 | $2,240 | $18,410 |
| 2019 | $850 | $15,470 | $1,540 | $13,930 |
| 2018 | $810 | $15,470 | $1,540 | $13,930 |
| 2017 | $809 | $15,470 | $1,540 | $13,930 |
| 2016 | $1,075 | $22,510 | $2,240 | $20,270 |
| 2015 | $1,086 | $22,510 | $2,240 | $20,270 |
| 2014 | $957 | $22,510 | $2,240 | $20,270 |
| 2013 | $821 | $19,850 | $2,450 | $17,400 |
Source: Public Records
Map
Nearby Homes
- 745 Maple Ave
- 238 Whitney St
- 681 Madison St
- 855 Spring St Unit S9
- 536 Madison St
- 475 State St
- 110 Edgewood Dr
- 18 Hillcrest Ct
- 474 Sherman St
- 375 Bliss Ave
- 555 Wrights Ave
- 450 Buffalo St
- 166 Welton Rd
- 386 Washington St
- 210 W Main Rd
- 404 Viaduct St
- VL Center Rd
- 284 Clay St
- 179 Marshall St
- 146 Nickle Plate Ave
Your Personal Tour Guide
Ask me questions while you tour the home.