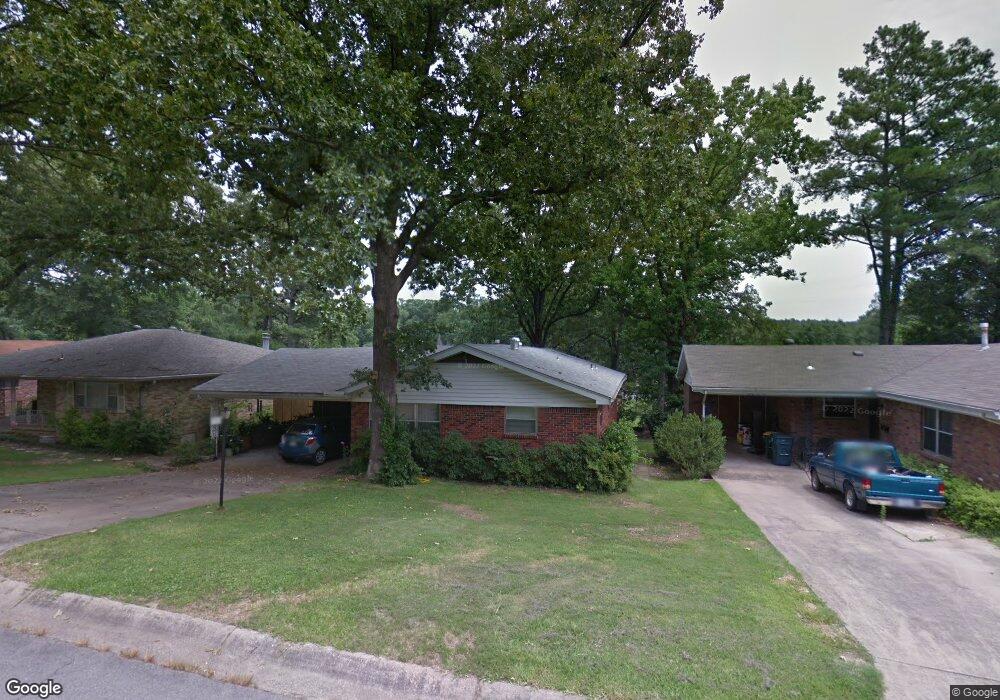
729 N Bryan St Little Rock, AR 72205
Midtown Little Rock NeighborhoodEstimated Value: $228,214 - $269,000
--
Bed
2
Baths
2,116
Sq Ft
$119/Sq Ft
Est. Value
About This Home
This home is located at 729 N Bryan St, Little Rock, AR 72205 and is currently estimated at $251,054, approximately $118 per square foot. 729 N Bryan St is a home located in Pulaski County with nearby schools including Brady Elementary School, J.A. Fair K8 Preparatory School, and Henderson Middle School.
Ownership History
Date
Name
Owned For
Owner Type
Purchase Details
Closed on
Apr 28, 2006
Sold by
Alexander Charlotte H
Bought by
Vogelgesang Anthony W and Vogelgesang Constance M
Current Estimated Value
Home Financials for this Owner
Home Financials are based on the most recent Mortgage that was taken out on this home.
Original Mortgage
$120,000
Outstanding Balance
$68,801
Interest Rate
6.32%
Mortgage Type
Fannie Mae Freddie Mac
Estimated Equity
$182,253
Purchase Details
Closed on
Apr 25, 2006
Sold by
Hearn Kenneth R and Hearn Family Revocable Living
Bought by
Vogelgesang Anthony W and Vogelgesang Constance M
Home Financials for this Owner
Home Financials are based on the most recent Mortgage that was taken out on this home.
Original Mortgage
$120,000
Outstanding Balance
$68,801
Interest Rate
6.32%
Mortgage Type
Fannie Mae Freddie Mac
Estimated Equity
$182,253
Create a Home Valuation Report for This Property
The Home Valuation Report is an in-depth analysis detailing your home's value as well as a comparison with similar homes in the area
Home Values in the Area
Average Home Value in this Area
Purchase History
| Date | Buyer | Sale Price | Title Company |
|---|---|---|---|
| Vogelgesang Anthony W | $150,000 | American Abstract & Title Co | |
| Vogelgesang Anthony W | -- | American Abstract & Title Co |
Source: Public Records
Mortgage History
| Date | Status | Borrower | Loan Amount |
|---|---|---|---|
| Open | Vogelgesang Anthony W | $120,000 |
Source: Public Records
Tax History Compared to Growth
Tax History
| Year | Tax Paid | Tax Assessment Tax Assessment Total Assessment is a certain percentage of the fair market value that is determined by local assessors to be the total taxable value of land and additions on the property. | Land | Improvement |
|---|---|---|---|---|
| 2024 | $2,071 | $37,203 | $8,000 | $29,203 |
| 2023 | $2,071 | $37,203 | $8,000 | $29,203 |
| 2022 | $2,071 | $37,203 | $8,000 | $29,203 |
| 2021 | $2,085 | $29,580 | $6,100 | $23,480 |
| 2020 | $1,696 | $29,580 | $6,100 | $23,480 |
| 2019 | $1,696 | $29,580 | $6,100 | $23,480 |
| 2018 | $1,721 | $29,580 | $6,100 | $23,480 |
| 2017 | $1,721 | $29,580 | $6,100 | $23,480 |
| 2016 | $1,734 | $30,390 | $5,980 | $24,410 |
| 2015 | $2,087 | $29,775 | $5,980 | $23,795 |
| 2014 | $2,087 | $29,775 | $5,980 | $23,795 |
Source: Public Records
Map
Nearby Homes
- 7023 H St
- 621 Mcadoo St
- 805 N Coolidge St
- 900 N Hughes St
- 7309 Gable Dr
- 516 N Coolidge St
- 508 N Coolidge St
- 1112 N Hughes St
- 618 Hall Dr
- 0 N Hughes St
- 4 Evergreen Cir
- 917 N Mississippi St
- 323 Auburn Dr
- 7020 Amherst Dr
- 6705 Evergreen Dr
- 1311 N Hughes St
- 4 Pilot Point Place
- 3 Lorine Cir
- 7011 W Markham St
- 405 N Plaza Dr