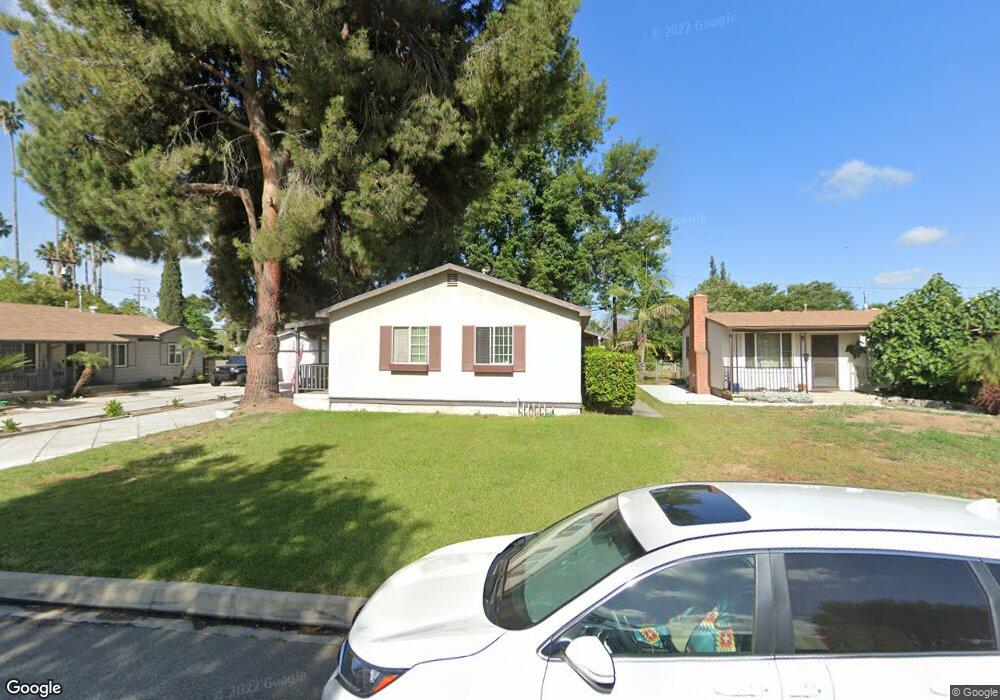
729 N Morada Ave West Covina, CA 91790
Estimated Value: $771,000 - $957,000
3
Beds
2
Baths
1,558
Sq Ft
$538/Sq Ft
Est. Value
About This Home
This home is located at 729 N Morada Ave, West Covina, CA 91790 and is currently estimated at $838,323, approximately $538 per square foot. 729 N Morada Ave is a home located in Los Angeles County with nearby schools including Grovecenter Elementary School, Traweek Middle School, and Covina High School.
Ownership History
Date
Name
Owned For
Owner Type
Purchase Details
Closed on
Apr 16, 2007
Sold by
Caston Carl W and Caston Stefanie
Bought by
Caston Ii Carl W
Current Estimated Value
Home Financials for this Owner
Home Financials are based on the most recent Mortgage that was taken out on this home.
Original Mortgage
$375,000
Outstanding Balance
$232,538
Interest Rate
6.62%
Mortgage Type
New Conventional
Estimated Equity
$605,785
Purchase Details
Closed on
Jan 29, 2003
Sold by
Lam Jenny H
Bought by
Caston Ii Carl W
Home Financials for this Owner
Home Financials are based on the most recent Mortgage that was taken out on this home.
Original Mortgage
$261,900
Interest Rate
5.82%
Purchase Details
Closed on
Oct 22, 2001
Sold by
Lam Jerry
Bought by
Lam Jenny H
Home Financials for this Owner
Home Financials are based on the most recent Mortgage that was taken out on this home.
Original Mortgage
$170,000
Interest Rate
6.84%
Create a Home Valuation Report for This Property
The Home Valuation Report is an in-depth analysis detailing your home's value as well as a comparison with similar homes in the area
Home Values in the Area
Average Home Value in this Area
Purchase History
| Date | Buyer | Sale Price | Title Company |
|---|---|---|---|
| Caston Ii Carl W | -- | First American Title Ins Co | |
| Caston Ii Carl W | $270,000 | First American Title Co | |
| Lam Jenny H | -- | -- |
Source: Public Records
Mortgage History
| Date | Status | Borrower | Loan Amount |
|---|---|---|---|
| Open | Caston Ii Carl W | $375,000 | |
| Previous Owner | Caston Ii Carl W | $261,900 | |
| Previous Owner | Lam Jenny H | $170,000 | |
| Closed | Caston Ii Carl W | $8,100 |
Source: Public Records
Tax History Compared to Growth
Tax History
| Year | Tax Paid | Tax Assessment Tax Assessment Total Assessment is a certain percentage of the fair market value that is determined by local assessors to be the total taxable value of land and additions on the property. | Land | Improvement |
|---|---|---|---|---|
| 2025 | $4,987 | $391,028 | $264,744 | $126,284 |
| 2024 | $4,987 | $383,361 | $259,553 | $123,808 |
| 2023 | $4,914 | $375,845 | $254,464 | $121,381 |
| 2022 | $4,848 | $368,476 | $249,475 | $119,001 |
| 2021 | $4,773 | $361,252 | $244,584 | $116,668 |
| 2019 | $4,654 | $350,539 | $237,331 | $113,208 |
| 2018 | $4,461 | $343,667 | $232,678 | $110,989 |
| 2016 | $4,200 | $330,324 | $223,644 | $106,680 |
| 2015 | $4,092 | $325,363 | $220,285 | $105,078 |
| 2014 | $4,039 | $318,990 | $215,970 | $103,020 |
Source: Public Records
Map
Nearby Homes
- 16319 E Elgenia St
- 1037 E Grovecenter St
- 1319 W Eckerman Ave
- 750 N Sunset Ave
- 557 N Broadmoor Ave
- 427 N Walnuthaven Dr
- 1005 W Greendale St
- 4221 N Hartley Ave
- 537 N Yaleton Ave
- 410 N Lyall Ave
- 338 N Lyall Ave
- 16123 E Ballentine Place
- 1423 W San Bernardino Rd Unit A
- 1366 E Louisa Ave
- 16150 E Queenside Dr
- 218 Lockhart Way
- 15917 E Ballentine Place
- 120 Poxon Place
- 104 Poxon Place
- 434 N Orange Ave
- 733 N Morada Ave
- 723 N Morada Ave
- 737 N Morada Ave
- 719 N Morada Ave
- 732 N Hartley St
- 738 N Hartley St
- 1123 W Puente Ave
- 743 N Morada Ave
- 728 N Morada Ave
- 732 N Morada Ave
- 728 N Hartley St
- 742 N Hartley St
- 713 N Morada Ave
- 736 N Morada Ave
- 712 N Morada Ave
- 720 N Hartley St
- 747 N Morada Ave
- 742 N Morada Ave
- 748 N Hartley St
- 716 N Hartley St