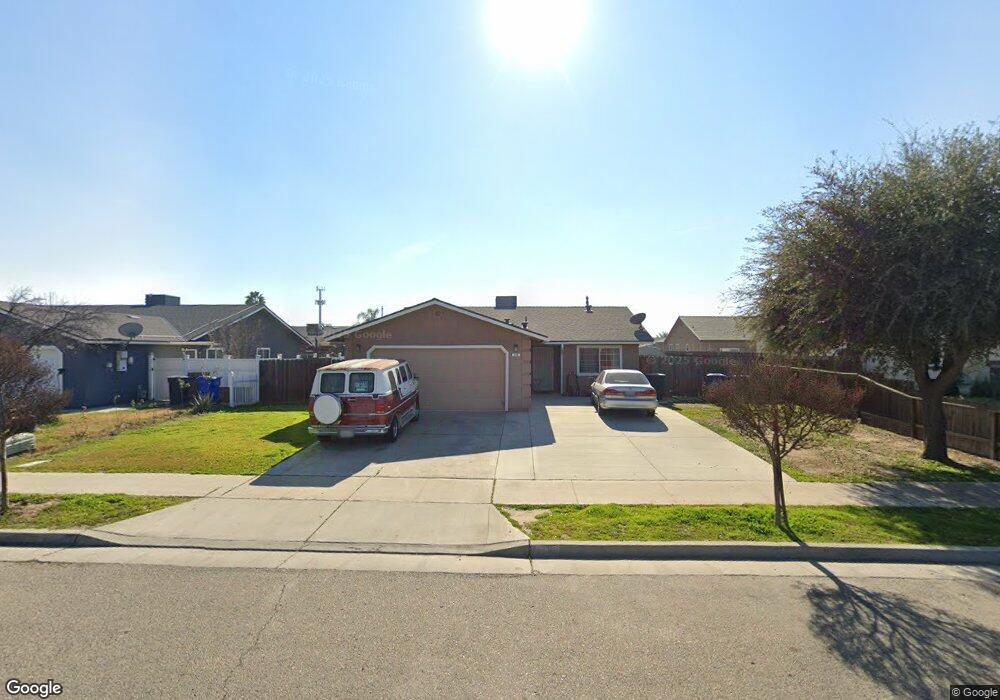
729 Otero St Lemoore, CA 93245
Estimated Value: $302,332 - $321,000
3
Beds
2
Baths
1,156
Sq Ft
$271/Sq Ft
Est. Value
About This Home
This home is located at 729 Otero St, Lemoore, CA 93245 and is currently estimated at $313,083, approximately $270 per square foot. 729 Otero St is a home located in Kings County with nearby schools including P.W. Engvall Elementary School, Liberty Middle School, and Lemoore High School.
Ownership History
Date
Name
Owned For
Owner Type
Purchase Details
Closed on
May 21, 2020
Sold by
Rangel Sylvia
Bought by
Ramos Eddie
Current Estimated Value
Purchase Details
Closed on
Dec 28, 2004
Sold by
Rangel Sylvia
Bought by
Rangel Sylvia and Hernandez Sarah F
Purchase Details
Closed on
Apr 9, 1997
Sold by
Self Help Enterprises
Bought by
Rangel Sylvia
Home Financials for this Owner
Home Financials are based on the most recent Mortgage that was taken out on this home.
Original Mortgage
$51,338
Interest Rate
6.97%
Mortgage Type
FHA
Create a Home Valuation Report for This Property
The Home Valuation Report is an in-depth analysis detailing your home's value as well as a comparison with similar homes in the area
Home Values in the Area
Average Home Value in this Area
Purchase History
| Date | Buyer | Sale Price | Title Company |
|---|---|---|---|
| Ramos Eddie | -- | None Available | |
| Rangel Sylvia | -- | -- | |
| Rangel Sylvia | $94,000 | Chicago Title Co |
Source: Public Records
Mortgage History
| Date | Status | Borrower | Loan Amount |
|---|---|---|---|
| Previous Owner | Rangel Sylvia | $51,338 | |
| Closed | Rangel Sylvia | $23,244 |
Source: Public Records
Tax History
| Year | Tax Paid | Tax Assessment Tax Assessment Total Assessment is a certain percentage of the fair market value that is determined by local assessors to be the total taxable value of land and additions on the property. | Land | Improvement |
|---|---|---|---|---|
| 2025 | $1,935 | $192,611 | $63,364 | $129,247 |
| 2023 | $1,935 | $185,133 | $60,904 | $124,229 |
| 2022 | $2,025 | $181,504 | $59,710 | $121,794 |
| 2021 | $1,974 | $177,946 | $58,540 | $119,406 |
| 2020 | $1,524 | $137,243 | $40,880 | $96,363 |
| 2019 | $1,511 | $134,552 | $40,078 | $94,474 |
| 2018 | $1,421 | $131,914 | $39,292 | $92,622 |
| 2017 | $1,423 | $129,328 | $38,522 | $90,806 |
| 2016 | $1,340 | $126,792 | $37,767 | $89,025 |
| 2015 | $1,333 | $124,888 | $37,200 | $87,688 |
| 2014 | $1,295 | $122,441 | $36,471 | $85,970 |
Source: Public Records
Map
Nearby Homes