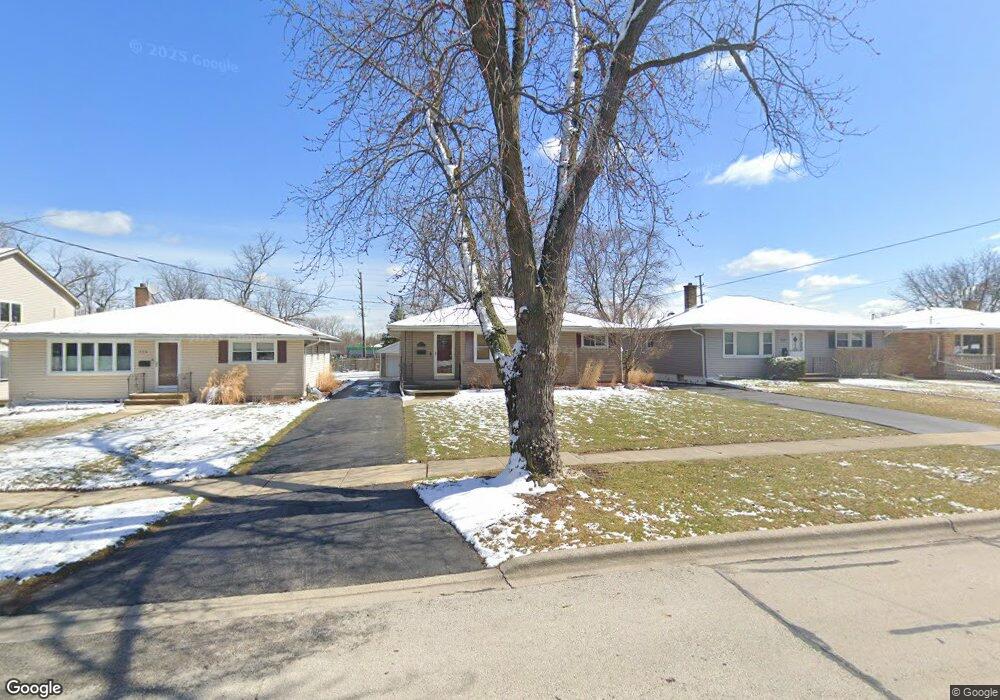
729 S Riverside Dr Villa Park, IL 60181
Estimated Value: $331,112 - $420,000
3
Beds
--
Bath
1,273
Sq Ft
$299/Sq Ft
Est. Value
About This Home
This home is located at 729 S Riverside Dr, Villa Park, IL 60181 and is currently estimated at $380,528, approximately $298 per square foot. 729 S Riverside Dr is a home located in DuPage County with nearby schools including Ardmore Elementary School, Jackson Middle School, and Willowbrook High School.
Ownership History
Date
Name
Owned For
Owner Type
Purchase Details
Closed on
Feb 10, 2017
Sold by
Hayes James R and Hayes Rebekah A
Bought by
Hayes James R and Hayes Rebekah A
Current Estimated Value
Home Financials for this Owner
Home Financials are based on the most recent Mortgage that was taken out on this home.
Original Mortgage
$254,147
Outstanding Balance
$123,965
Interest Rate
3.25%
Mortgage Type
FHA
Estimated Equity
$256,563
Purchase Details
Closed on
Dec 31, 2005
Sold by
Kerby Judith and Landa Linda
Bought by
Hayes James R and Castady Rebekah A
Home Financials for this Owner
Home Financials are based on the most recent Mortgage that was taken out on this home.
Original Mortgage
$216,000
Interest Rate
6.46%
Mortgage Type
Fannie Mae Freddie Mac
Purchase Details
Closed on
Nov 12, 1996
Sold by
American National Bk & Tr Co Of Chicago
Bought by
Kovarik Edwin J and The Edwin J Kovarik Declaration Of Trust
Create a Home Valuation Report for This Property
The Home Valuation Report is an in-depth analysis detailing your home's value as well as a comparison with similar homes in the area
Home Values in the Area
Average Home Value in this Area
Purchase History
| Date | Buyer | Sale Price | Title Company |
|---|---|---|---|
| Hayes James R | -- | None Available | |
| Hayes James R | $270,000 | Chicago Title Insurance Comp | |
| Kovarik Edwin J | -- | -- |
Source: Public Records
Mortgage History
| Date | Status | Borrower | Loan Amount |
|---|---|---|---|
| Open | Hayes James R | $254,147 | |
| Closed | Hayes James R | $216,000 |
Source: Public Records
Tax History
| Year | Tax Paid | Tax Assessment Tax Assessment Total Assessment is a certain percentage of the fair market value that is determined by local assessors to be the total taxable value of land and additions on the property. | Land | Improvement |
|---|---|---|---|---|
| 2024 | $7,287 | $104,410 | $42,348 | $62,062 |
| 2023 | $6,933 | $96,550 | $39,160 | $57,390 |
| 2022 | $6,750 | $92,820 | $37,650 | $55,170 |
| 2021 | $6,474 | $90,510 | $36,710 | $53,800 |
| 2020 | $6,319 | $88,530 | $35,910 | $52,620 |
| 2019 | $5,897 | $84,170 | $34,140 | $50,030 |
| 2018 | $5,855 | $78,890 | $32,000 | $46,890 |
| 2017 | $5,711 | $75,170 | $30,490 | $44,680 |
| 2016 | $5,546 | $70,810 | $28,720 | $42,090 |
| 2015 | $5,463 | $65,970 | $26,760 | $39,210 |
| 2014 | $5,641 | $68,170 | $35,210 | $32,960 |
| 2013 | $5,377 | $69,130 | $35,710 | $33,420 |
Source: Public Records
Map
Nearby Homes
- 614 E Madison St
- 769 S Fairview Ave
- 722 S Berkley Ave
- 625 E Van Buren St
- 602 S Sunnyside Ave
- 476 W Vallette St
- 329 S Monterey Ave
- 593 S Sunnyside Ave
- 663 S Hawthorne Ave
- 613 S Summit Ave
- 1105 S Euclid Ave
- 1S628 Oakbrook Lake
- 316 E Highland Ave
- 594 S Fairfield Ave
- 868 S Spring Rd
- 529 E Park Blvd
- 232 S Oakland Ave
- 742 S Saylor Ave
- 964 S Hillside Ave
- 502 S Fairview Ave
- 733 S Riverside Dr
- 725 S Riverside Dr
- 739 S Riverside Dr
- 713 S Riverside Dr
- 743 S Riverside Dr
- 711 S Riverside Dr
- 730 S Riverside Dr
- 734 S Riverside Dr
- 714 E Madison St
- 720 S Riverside Dr
- 710 E Madison St
- 742 S Riverside Dr
- 718 E Madison St
- 714 S Riverside Dr
- 707 S Riverside Dr
- 716 S Riverside Dr
- 746 S Riverside Dr
- 712 S Riverside Dr
- 632 E Madison St
- 710 S Riverside Dr
Your Personal Tour Guide
Ask me questions while you tour the home.