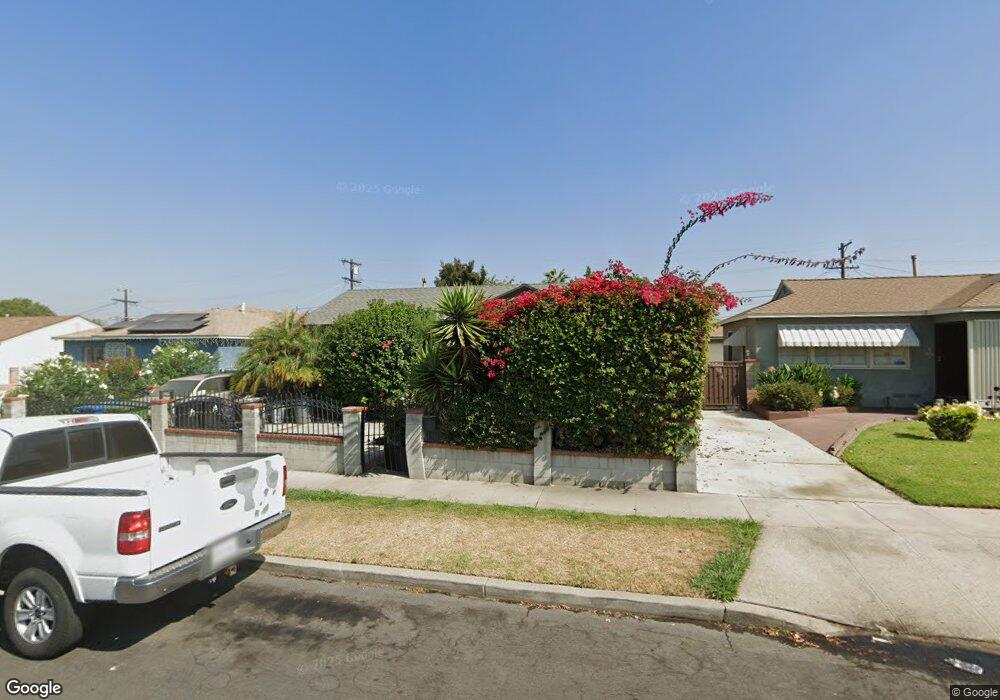
729 W 142nd St Gardena, CA 90247
Harbor Gateway NeighborhoodEstimated Value: $595,000 - $744,000
2
Beds
1
Bath
856
Sq Ft
$821/Sq Ft
Est. Value
About This Home
This home is located at 729 W 142nd St, Gardena, CA 90247 and is currently estimated at $702,415, approximately $820 per square foot. 729 W 142nd St is a home located in Los Angeles County with nearby schools including One Hundred Thirty-Fifth Street Elementary School, Avalon Gardens Elementary School, and Purche Avenue Elementary School.
Ownership History
Date
Name
Owned For
Owner Type
Purchase Details
Closed on
Dec 20, 2007
Sold by
Belov Andrew and Perez Michelle
Bought by
Belov Andrew
Current Estimated Value
Home Financials for this Owner
Home Financials are based on the most recent Mortgage that was taken out on this home.
Original Mortgage
$96,720
Interest Rate
6.09%
Mortgage Type
New Conventional
Purchase Details
Closed on
Mar 20, 2001
Sold by
Stannard Greg and Stannard Rosalva Cunningham
Bought by
Belov Andrew
Home Financials for this Owner
Home Financials are based on the most recent Mortgage that was taken out on this home.
Original Mortgage
$162,653
Interest Rate
7.03%
Mortgage Type
FHA
Purchase Details
Closed on
Sep 15, 1994
Sold by
Stannard Rosalva Cunningham and Cunningham Rosalva
Bought by
Stannard Greg
Home Financials for this Owner
Home Financials are based on the most recent Mortgage that was taken out on this home.
Original Mortgage
$101,200
Interest Rate
8.37%
Create a Home Valuation Report for This Property
The Home Valuation Report is an in-depth analysis detailing your home's value as well as a comparison with similar homes in the area
Home Values in the Area
Average Home Value in this Area
Purchase History
| Date | Buyer | Sale Price | Title Company |
|---|---|---|---|
| Belov Andrew | -- | Orange Coast Title Company | |
| Belov Andrew | $167,500 | Chicago Title Co | |
| Stannard Greg | -- | Provident Title |
Source: Public Records
Mortgage History
| Date | Status | Borrower | Loan Amount |
|---|---|---|---|
| Closed | Belov Andrew | $96,720 | |
| Previous Owner | Belov Andrew | $162,653 | |
| Previous Owner | Stannard Greg | $101,200 |
Source: Public Records
Tax History
| Year | Tax Paid | Tax Assessment Tax Assessment Total Assessment is a certain percentage of the fair market value that is determined by local assessors to be the total taxable value of land and additions on the property. | Land | Improvement |
|---|---|---|---|---|
| 2025 | $3,901 | $291,441 | $201,909 | $89,532 |
| 2024 | $3,901 | $285,727 | $197,950 | $87,777 |
| 2023 | $3,829 | $280,125 | $194,069 | $86,056 |
| 2022 | $3,660 | $274,633 | $190,264 | $84,369 |
| 2021 | $3,611 | $269,249 | $186,534 | $82,715 |
| 2019 | $3,508 | $261,264 | $181,002 | $80,262 |
| 2018 | $3,430 | $256,142 | $177,453 | $78,689 |
| 2016 | $3,271 | $246,198 | $170,563 | $75,635 |
| 2015 | $3,222 | $242,500 | $168,001 | $74,499 |
| 2014 | $3,235 | $237,751 | $164,711 | $73,040 |
Source: Public Records
Map
Nearby Homes
- 14100 S Ainsworth St
- 825 W 144th St
- 14047 Pearl Ln Unit 2
- 13713 S Vermont Ave Unit 25
- 13713 S Vermont Ave
- 13713 S Vermont Ave Unit 7
- 13713 S Vermont Ave Unit 15
- 13713 S Vermont Ave Unit 10
- 13607 S Menlo Ave
- 13509 S Ainsworth St
- 1239 W Rosecrans Ave Unit 31
- 1239 W Rosecrans Ave Unit 26
- 1239 W Rosecrans Ave Unit 11
- 1103 W 149th St
- 1261 139th St
- 14404 Kiwi Ln Unit 6
- 1364 W 139th St Unit B
- 1335 W 139th St
- 640 W Redondo Beach Blvd
- 13919 S Normandie Ave Unit 20
Your Personal Tour Guide
Ask me questions while you tour the home.