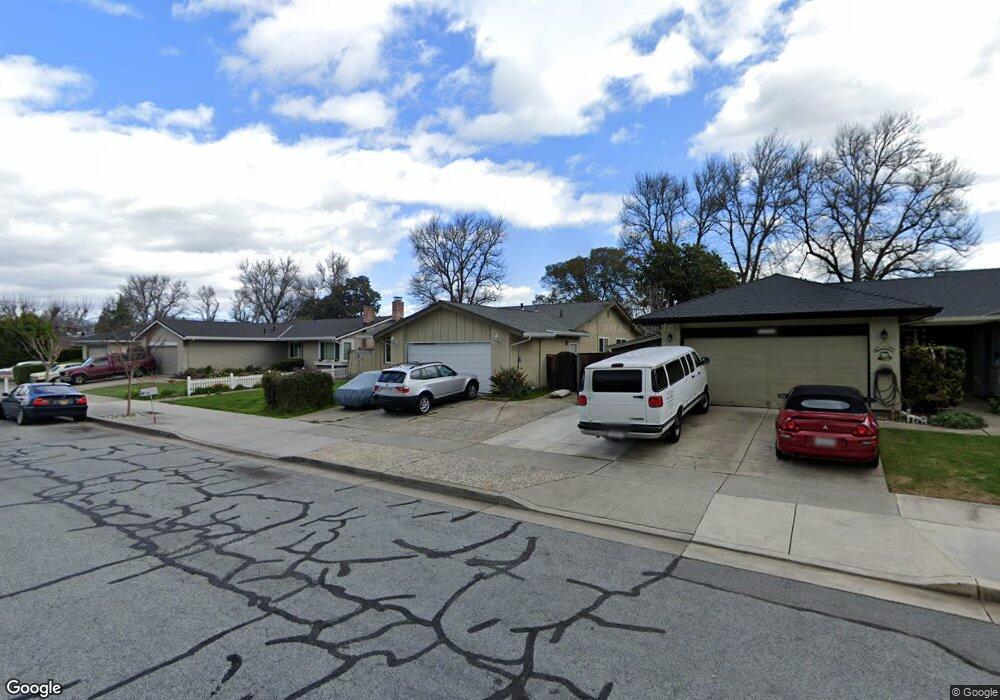
7290 Carr Place Gilroy, CA 95020
Estimated Value: $873,322 - $1,030,000
3
Beds
2
Baths
1,304
Sq Ft
$718/Sq Ft
Est. Value
About This Home
This home is located at 7290 Carr Place, Gilroy, CA 95020 and is currently estimated at $935,831, approximately $717 per square foot. 7290 Carr Place is a home located in Santa Clara County with nearby schools including El Roble Elementary School, Brownell Middle School, and Solorsano Middle School.
Ownership History
Date
Name
Owned For
Owner Type
Purchase Details
Closed on
Sep 2, 2020
Sold by
Juarez Juan A and Fagundes Filomena M
Bought by
Juan A Juarez And Filomena M Fagundes Living and Juarez
Current Estimated Value
Home Financials for this Owner
Home Financials are based on the most recent Mortgage that was taken out on this home.
Original Mortgage
$200,000
Outstanding Balance
$177,487
Interest Rate
2.9%
Mortgage Type
New Conventional
Estimated Equity
$758,344
Purchase Details
Closed on
Mar 2, 2018
Sold by
Juarez Juan A and Fagundes Filomena M
Bought by
Juarez Juan A and Fagundes Filomena M
Purchase Details
Closed on
Apr 24, 2009
Sold by
Fagundes Filomena M and Juarez Juan Antonio
Bought by
Fagundes Filomena M and Juarez Juan A
Home Financials for this Owner
Home Financials are based on the most recent Mortgage that was taken out on this home.
Original Mortgage
$150,000
Interest Rate
4.99%
Mortgage Type
New Conventional
Create a Home Valuation Report for This Property
The Home Valuation Report is an in-depth analysis detailing your home's value as well as a comparison with similar homes in the area
Home Values in the Area
Average Home Value in this Area
Purchase History
| Date | Buyer | Sale Price | Title Company |
|---|---|---|---|
| Juan A Juarez And Filomena M Fagundes Living | -- | First American Title | |
| Juarez Juan A | -- | First American Title | |
| Juarez Juan A | -- | None Available | |
| Fagundes Filomena M | -- | Chicago Title Company |
Source: Public Records
Mortgage History
| Date | Status | Borrower | Loan Amount |
|---|---|---|---|
| Open | Juarez Juan A | $200,000 | |
| Previous Owner | Fagundes Filomena M | $150,000 |
Source: Public Records
Tax History Compared to Growth
Tax History
| Year | Tax Paid | Tax Assessment Tax Assessment Total Assessment is a certain percentage of the fair market value that is determined by local assessors to be the total taxable value of land and additions on the property. | Land | Improvement |
|---|---|---|---|---|
| 2025 | $3,869 | $311,006 | $124,400 | $186,606 |
| 2024 | $3,869 | $304,909 | $121,961 | $182,948 |
| 2023 | $3,846 | $298,931 | $119,570 | $179,361 |
| 2022 | $3,782 | $293,071 | $117,226 | $175,845 |
| 2021 | $3,764 | $287,326 | $114,928 | $172,398 |
| 2020 | $3,722 | $284,381 | $113,750 | $170,631 |
| 2019 | $3,689 | $278,806 | $111,520 | $167,286 |
| 2018 | $3,447 | $273,340 | $109,334 | $164,006 |
| 2017 | $3,518 | $267,982 | $107,191 | $160,791 |
| 2016 | $3,441 | $262,729 | $105,090 | $157,639 |
| 2015 | $3,249 | $258,784 | $103,512 | $155,272 |
| 2014 | $3,228 | $253,716 | $101,485 | $152,231 |
Source: Public Records
Map
Nearby Homes
- 7210 Yorktown Dr
- 7305 Chadwick St
- 7245 Trenton Place
- 7363 Ailes Ct Unit Homesite 5
- 7379 Ailes Ct Unit Homesite 3
- 7352 Ailes Ct Unit Homesite 7
- 7360 Ailes Ct Unit Homesite 8
- 7376 Ailes Ct Unit Homesite 10
- 895 Greenwich Dr
- 7343 Princevalle St Unit Homesite 19
- 7351 Princevalle St Unit Homesite 18
- Plan 2 at Heritage on 6th Street
- Plan 1 at Heritage on 6th Street
- 7359 Princevalle St Unit Homesite 17
- 7391 Princevalle St Unit Homesite 13
- 7035 Yorktown Dr
- 775 Williamsburg Way Unit B
- 771 Williamsburg Way Unit C
- 773 Gettysburg Way
- 738 Gettysburg Way
- 7308 Carr Place
- 7272 Carr Place
- 7281 Miller Ave
- 7301 Miller Ave
- 7326 Carr Place
- 7254 Carr Place
- 7267 Miller Ave
- 7291 Carr Place
- 7317 Miller Ave
- 7309 Carr Place
- 7251 Miller Ave
- 7273 Carr Place
- 7236 Carr Place
- 7344 Carr Place
- 7327 Carr Place
- 7335 Miller Ave
- 7255 Carr Place
- 7235 Miller Ave
- 7362 Carr Place
- 7218 Carr Place