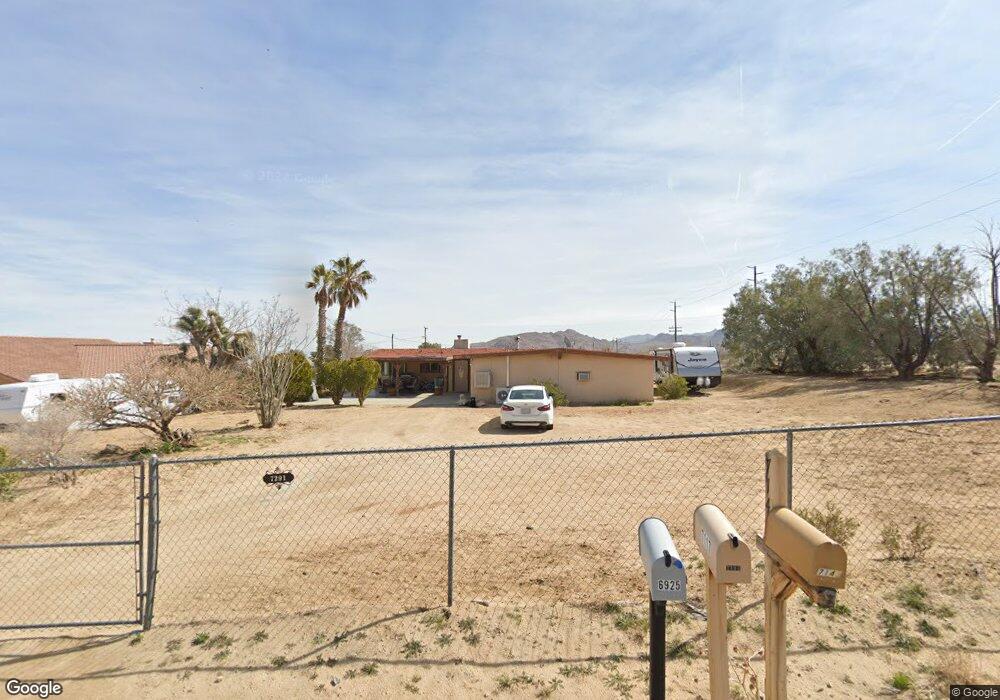
7291 Juniper Rd Joshua Tree, CA 92252
Estimated Value: $429,744 - $1,316,000
2
Beds
2
Baths
2,007
Sq Ft
$372/Sq Ft
Est. Value
About This Home
This home is located at 7291 Juniper Rd, Joshua Tree, CA 92252 and is currently estimated at $747,186, approximately $372 per square foot. 7291 Juniper Rd is a home located in San Bernardino County with nearby schools including Friendly Hills Elementary School, La Contenta Middle School, and Yucca Valley High School.
Ownership History
Date
Name
Owned For
Owner Type
Purchase Details
Closed on
Aug 12, 2011
Sold by
Decicco Amy
Bought by
Decicco Theodore J
Current Estimated Value
Purchase Details
Closed on
Aug 27, 2003
Sold by
Campbell Gina L
Bought by
Campbell Gina
Home Financials for this Owner
Home Financials are based on the most recent Mortgage that was taken out on this home.
Original Mortgage
$55,000
Outstanding Balance
$24,138
Interest Rate
5.46%
Mortgage Type
Purchase Money Mortgage
Estimated Equity
$723,048
Purchase Details
Closed on
Jun 16, 2003
Sold by
Campbell Todd W
Bought by
Campbell Gina
Home Financials for this Owner
Home Financials are based on the most recent Mortgage that was taken out on this home.
Original Mortgage
$55,000
Interest Rate
5.46%
Mortgage Type
Purchase Money Mortgage
Purchase Details
Closed on
Jan 10, 2002
Sold by
Thompson Juliana T and Decicco Victoria A
Bought by
Campbell Gina L
Create a Home Valuation Report for This Property
The Home Valuation Report is an in-depth analysis detailing your home's value as well as a comparison with similar homes in the area
Home Values in the Area
Average Home Value in this Area
Purchase History
| Date | Buyer | Sale Price | Title Company |
|---|---|---|---|
| Decicco Theodore J | -- | Fidelity National Title | |
| Campbell Gina | -- | Fidelity National Title | |
| Campbell Gina | -- | Fidelity National Title | |
| Campbell Gina L | -- | -- |
Source: Public Records
Mortgage History
| Date | Status | Borrower | Loan Amount |
|---|---|---|---|
| Open | Campbell Gina | $55,000 | |
| Closed | Campbell Gina | $55,000 |
Source: Public Records
Tax History
| Year | Tax Paid | Tax Assessment Tax Assessment Total Assessment is a certain percentage of the fair market value that is determined by local assessors to be the total taxable value of land and additions on the property. | Land | Improvement |
|---|---|---|---|---|
| 2025 | $1,579 | $107,183 | $10,864 | $96,319 |
| 2024 | $1,515 | $105,081 | $10,651 | $94,430 |
| 2023 | $1,487 | $103,020 | $10,442 | $92,578 |
| 2022 | $1,458 | $101,000 | $10,237 | $90,763 |
| 2021 | $1,442 | $99,019 | $10,036 | $88,983 |
| 2020 | $1,429 | $98,004 | $9,933 | $88,071 |
| 2019 | $1,497 | $96,082 | $9,738 | $86,344 |
| 2018 | $1,326 | $94,198 | $9,547 | $84,651 |
| 2017 | $1,313 | $92,351 | $9,360 | $82,991 |
| 2016 | $1,293 | $90,540 | $9,176 | $81,364 |
| 2015 | $1,268 | $89,180 | $9,038 | $80,142 |
| 2014 | $1,277 | $87,433 | $8,861 | $78,572 |
Source: Public Records
Map
Nearby Homes
- 7217 Sunny Vista Rd
- 7079 Juniper Rd
- 0 Latham Trail Unit 219133231DA
- 60413 Alta Loma Dr
- 7035 Sunny Vista Rd
- 7024 Saddleback Rd
- 7564 Vista Rd
- 61375 Latham Trail
- 7276 Encina Rd
- 61381 Alta Mura Dr
- 61424 Latham Trail
- 61138 Onaga Trail
- 61246 Melton Trail
- 6925 Sunnyhill Rd
- 5814 Sunburst Dr
- 60789 Pueblo Trail
- 60432 Latham Trail
- 22999 Sunny Vista Rd
- 1725 Sunny Vista Rd
- 61464 Melton Trail
- 7275 Juniper Rd
- 60671 Alta Loma Dr
- 59500 Alta Loma Dr
- 60195 Alta Loma Dr
- 60535 Alta Loma Dr
- 60206 Alta Loma Dr
- 60611 Alta Loma Dr
- 9999 Alta Loma Dr
- 60631 Alta Loma Dr
- 59653 Alta Loma Dr
- 7329 Juniper Rd
- 7237 Juniper Rd
- 60988 Alta Loma Dr
- 7260 Saddleback Rd
- 7236 Saddleback Rd
- 61115 Alta Loma Dr
- 7228 Juniper Rd
- 7214 Saddleback Rd
- 60923 Alta Loma Dr
- 7233 Sunny Vista Rd
Your Personal Tour Guide
Ask me questions while you tour the home.