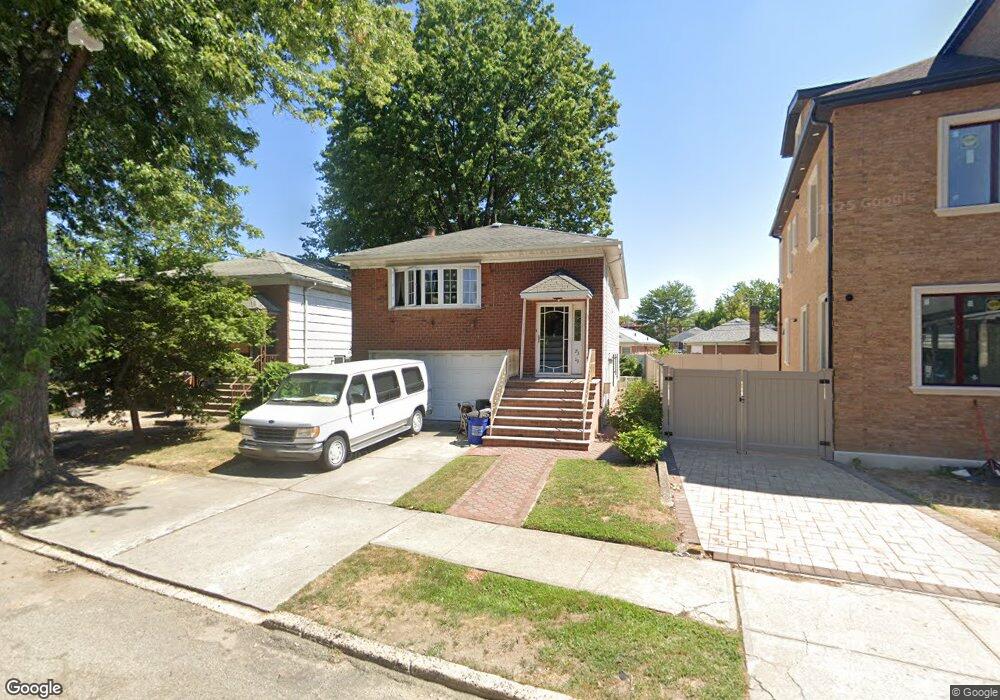
73-19 170th St Flushing, NY 11366
Hillcrest NeighborhoodEstimated Value: $1,225,000 - $1,296,000
Studio
--
Bath
1,687
Sq Ft
$754/Sq Ft
Est. Value
About This Home
This home is located at 73-19 170th St, Flushing, NY 11366 and is currently estimated at $1,272,082, approximately $754 per square foot. 73-19 170th St is a home located in Queens County with nearby schools including P.S. 173 - Fresh Meadow and George J. Ryan Middle School 216.
Ownership History
Date
Name
Owned For
Owner Type
Purchase Details
Closed on
Feb 14, 2004
Sold by
Rodriquez Thelma B and Rodriquez Thomas Neil
Bought by
Rodriquez Thomas Neil B
Current Estimated Value
Purchase Details
Closed on
Nov 25, 1998
Sold by
Farrell Mccoy Realinda
Bought by
Rodriguez Thomas Neil B and Rodriguez Tomas D
Home Financials for this Owner
Home Financials are based on the most recent Mortgage that was taken out on this home.
Original Mortgage
$170,000
Interest Rate
6.7%
Create a Home Valuation Report for This Property
The Home Valuation Report is an in-depth analysis detailing your home's value as well as a comparison with similar homes in the area
Home Values in the Area
Average Home Value in this Area
Purchase History
| Date | Buyer | Sale Price | Title Company |
|---|---|---|---|
| Rodriquez Thomas Neil B | -- | -- | |
| Rodriquez Thomas Neil B | -- | -- | |
| Rodriguez Thomas Neil B | $245,000 | Fidelity National Title Ins | |
| Rodriguez Thomas Neil B | $245,000 | Fidelity National Title Ins |
Source: Public Records
Mortgage History
| Date | Status | Borrower | Loan Amount |
|---|---|---|---|
| Closed | Rodriguez Thomas Neil B | $170,000 |
Source: Public Records
Tax History
| Year | Tax Paid | Tax Assessment Tax Assessment Total Assessment is a certain percentage of the fair market value that is determined by local assessors to be the total taxable value of land and additions on the property. | Land | Improvement |
|---|---|---|---|---|
| 2025 | $10,677 | $54,847 | $13,531 | $41,316 |
| 2024 | $10,689 | $54,557 | $14,933 | $39,624 |
| 2023 | $10,056 | $51,469 | $13,497 | $37,972 |
| 2022 | $9,406 | $58,860 | $18,000 | $40,860 |
| 2021 | $9,899 | $62,400 | $18,000 | $44,400 |
| 2020 | $9,379 | $61,740 | $18,000 | $43,740 |
| 2019 | $9,218 | $57,660 | $18,000 | $39,660 |
| 2018 | $8,446 | $42,891 | $16,246 | $26,645 |
| 2017 | $7,949 | $40,464 | $16,229 | $24,235 |
| 2016 | $7,761 | $40,464 | $16,229 | $24,235 |
| 2015 | $4,604 | $38,088 | $17,889 | $20,199 |
| 2014 | $4,604 | $37,887 | $18,915 | $18,972 |
Source: Public Records
Map
Nearby Homes
- 73-10 169th St
- 75-05 168th St
- 7126 170th St
- 7533 168th St
- 7042 173rd St
- 7115 167th St
- 76-04 167th St
- 70-07 171st St
- 71-39 166th St
- 16602 76th Ave
- 71-37 166th St
- 7662 174th St
- 164-12 76th Ave
- 164-38 77th Ave
- 163-07 72nd Ave Unit 5C
- 163-07 72nd Ave Unit 4D
- 163-07 72nd Ave Unit 5A
- 163-07 72nd Ave Unit 2D
- 163-07 72nd Ave Unit 2G
- 163-07 72nd Ave Unit 4E
- 7319 170th St
- 7319 170th St
- 73-15 170th St Unit 1
- 73-15 170th St Unit TH
- 73-15 170th St
- 7315 170th St
- 7325 170th St
- 73-25 170 St
- 7325 170th St
- 7311 170th St
- 7322 171st St
- 7322 171st St
- 7326 171st St
- 7318 171st St
- 17003 75th Ave
- 7318 171st St
- 17009 75th Ave
- 7330 171st St
- 7316 170th St
- 170-09 75th Ave
Your Personal Tour Guide
Ask me questions while you tour the home.