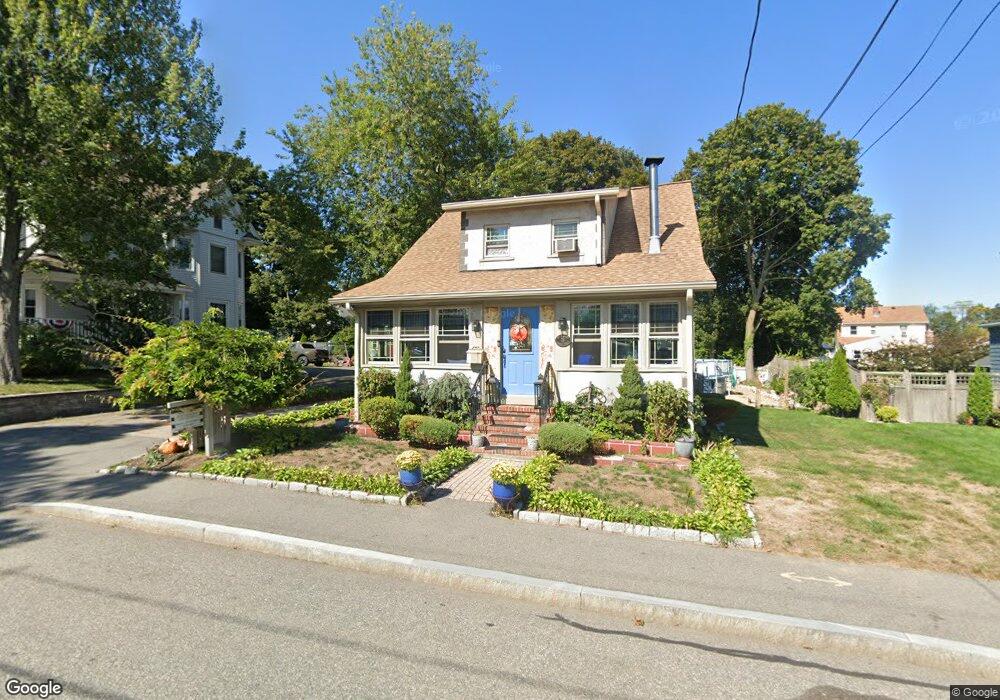
73 Academy St Braintree, MA 02184
North Braintree NeighborhoodEstimated Value: $772,000 - $978,000
3
Beds
3
Baths
2,122
Sq Ft
$401/Sq Ft
Est. Value
About This Home
This home is located at 73 Academy St, Braintree, MA 02184 and is currently estimated at $851,833, approximately $401 per square foot. 73 Academy St is a home located in Norfolk County with nearby schools including Braintree High School, Step Ahead Kindergarten, and Meeting House Montessori School.
Ownership History
Date
Name
Owned For
Owner Type
Purchase Details
Closed on
Jun 3, 2013
Sold by
Obrien Eileen C
Bought by
Eileen C Obrien T and Obrien Eileen C
Current Estimated Value
Purchase Details
Closed on
Mar 20, 1992
Sold by
Young Jonathan C and Young Margaret
Bought by
Obrien Eileen C
Create a Home Valuation Report for This Property
The Home Valuation Report is an in-depth analysis detailing your home's value as well as a comparison with similar homes in the area
Home Values in the Area
Average Home Value in this Area
Purchase History
| Date | Buyer | Sale Price | Title Company |
|---|---|---|---|
| Eileen C Obrien T | -- | -- | |
| Obrien Eileen C | $155,000 | -- | |
| Obrien Eileen C | $155,000 | -- |
Source: Public Records
Mortgage History
| Date | Status | Borrower | Loan Amount |
|---|---|---|---|
| Previous Owner | Obrien Eileen C | $271,000 | |
| Previous Owner | Obrien Eileen C | $22,500 | |
| Previous Owner | Obrien Eileen C | $134,500 |
Source: Public Records
Tax History
| Year | Tax Paid | Tax Assessment Tax Assessment Total Assessment is a certain percentage of the fair market value that is determined by local assessors to be the total taxable value of land and additions on the property. | Land | Improvement |
|---|---|---|---|---|
| 2025 | $6,890 | $690,400 | $367,000 | $323,400 |
| 2024 | $6,262 | $660,600 | $344,100 | $316,500 |
| 2023 | $5,972 | $611,900 | $312,000 | $299,900 |
| 2022 | $5,723 | $575,200 | $275,300 | $299,900 |
| 2021 | $5,557 | $558,500 | $275,300 | $283,200 |
| 2020 | $5,066 | $513,800 | $242,200 | $271,600 |
| 2019 | $4,995 | $495,000 | $242,200 | $252,800 |
| 2018 | $4,687 | $444,700 | $201,900 | $242,800 |
| 2017 | $4,633 | $431,400 | $201,900 | $229,500 |
| 2016 | $4,434 | $403,800 | $183,500 | $220,300 |
| 2015 | $4,357 | $393,600 | $180,800 | $212,800 |
| 2014 | $4,135 | $362,100 | $164,200 | $197,900 |
Source: Public Records
Map
Nearby Homes
- 5 Woodsum Dr Unit 12
- 491 Washington St Unit 1
- 469-471 Washington St
- 6 Franklin St
- 87 Walnut St
- 18 Royal Lake Dr Unit 3
- 50 Cleveland Ave
- 36 Chestnut Ave
- 145 Hancock St Unit 307
- 145 Hancock St Unit 201
- 20 Vine St
- 7 Del's Way
- 63 Dickerman Ln
- 418 John Mahar Hwy Unit 408
- 15 Calvin St
- 29 Saint Michael Rd
- 422 John Mahar Hwy Unit 408
- 44 Shepard Rd
- 29 Joseph Rd
- 426 John Mahar Hwy Unit 311
Your Personal Tour Guide
Ask me questions while you tour the home.