R
Seller's Agent in 2025
Ron Mercurio
RE/MAX Preferred
(401) 699-6666
1 in this area
152 Total Sales
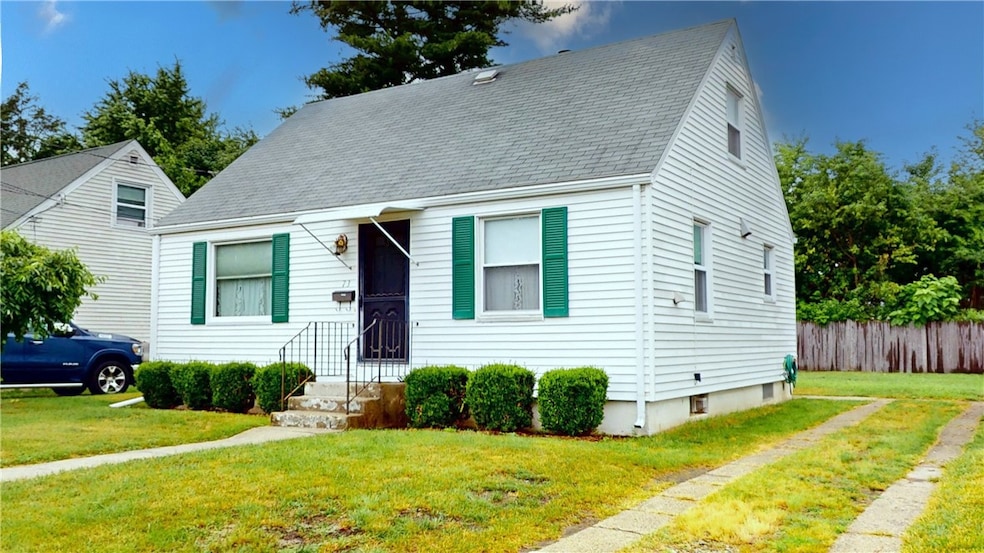
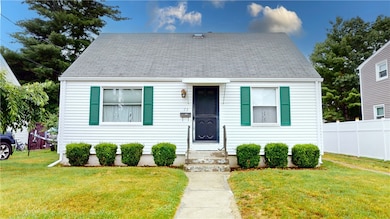
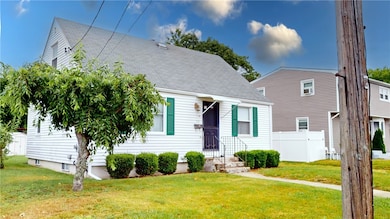
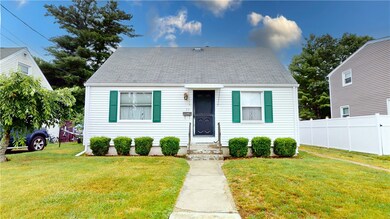
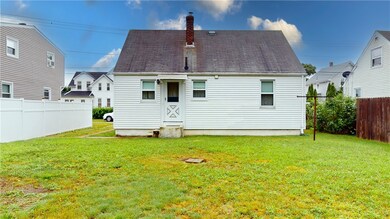
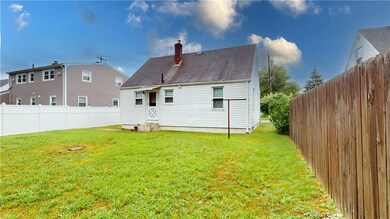
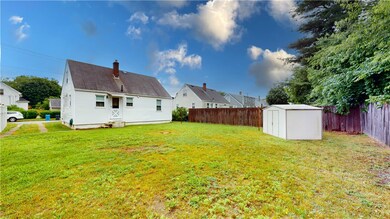
Check out this well-maintained 3-4 bedroom, 1-bath Cape nestled on a quiet street with a fenced-in backyard perfect for relaxing, entertaining, or letting pets roam! This classic home offers curb appeal with clean vinyl siding, green shutters, and a welcoming front entry. Inside, you'll find a spacious layout featuring a bright living room, original hardwood floors, laminate flooring, and a large eat-in kitchen full of vintage charm and cabinet space. The main level features two comfortably sized bedrooms and a full bath, while the second level offers two additional bedrooms with cozy nooks, built-in shelving, and plenty of storage. A first-floor laundry area adds convenience, and the partially finished basement provides even more flexible space ideal for a playroom, hobby area, or bonus family room. Additional features include gas heating, vinyl replacement windows, off-street parking, and a storage shed. With solid bones and loads of potential, this charming home is ready for your personal touch. Schedule your showing today before it's gone!
| Date | Type | Sale Price | Title Company |
|---|---|---|---|
| Warranty Deed | $336,000 | -- | |
| Quit Claim Deed | -- | -- | |
| Quit Claim Deed | -- | -- | |
| Quit Claim Deed | -- | -- | |
| Quit Claim Deed | -- | -- |
| Date | Status | Loan Amount | Loan Type |
|---|---|---|---|
| Open | $329,914 | FHA | |
| Previous Owner | $10,000 | No Value Available | |
| Previous Owner | $10,000 | No Value Available |
| Date | Event | Price | List to Sale | Price per Sq Ft |
|---|---|---|---|---|
| 09/11/2025 09/11/25 | Sold | $336,000 | -0.9% | $311 / Sq Ft |
| 07/23/2025 07/23/25 | Pending | -- | -- | -- |
| 06/26/2025 06/26/25 | For Sale | $339,000 | -- | $314 / Sq Ft |
| Year | Tax Paid | Tax Assessment Tax Assessment Total Assessment is a certain percentage of the fair market value that is determined by local assessors to be the total taxable value of land and additions on the property. | Land | Improvement |
|---|---|---|---|---|
| 2025 | $4,179 | $301,100 | $98,800 | $202,300 |
| 2024 | $4,041 | $296,900 | $98,800 | $198,100 |
| 2023 | $3,848 | $203,600 | $65,000 | $138,600 |
| 2022 | $3,769 | $203,600 | $65,000 | $138,600 |
| 2021 | $3,665 | $203,600 | $65,000 | $138,600 |
| 2020 | $3,469 | $167,000 | $61,900 | $105,100 |
| 2019 | $3,469 | $167,000 | $61,900 | $105,100 |
| 2018 | $3,388 | $167,000 | $61,900 | $105,100 |
| 2017 | $3,413 | $148,800 | $55,800 | $93,000 |
| 2016 | $3,341 | $148,800 | $55,800 | $93,000 |
| 2015 | $3,341 | $148,800 | $55,800 | $93,000 |
| 2014 | $3,314 | $145,100 | $55,800 | $89,300 |
R
Seller's Agent in 2025
Ron Mercurio
RE/MAX Preferred
(401) 699-6666
1 in this area
152 Total Sales

Buyer's Agent in 2025
Charletty Bras
Century 21 Limitless
(401) 954-4984
1 in this area
17 Total Sales
Source: State-Wide MLS
MLS Number: 1388707
APN: CRAN-000005-000003-001047
Disclaimer: Certain information contained herein is derived from information provided by parties other than Homes.com. All information provided is deemed reliable, but is not guaranteed to be accurate and should be independently verified.
![]() IDX information is provided exclusively for personal, non-commercial use, and may not be used for any purpose other than to identify prospective properties consumers may be interested in purchasing. Information is deemed reliable but not guaranteed.
IDX information is provided exclusively for personal, non-commercial use, and may not be used for any purpose other than to identify prospective properties consumers may be interested in purchasing. Information is deemed reliable but not guaranteed.
Copyright © 2026 State-Wide MLS, Inc. All rights reserved.
Ask me questions while you tour the home.