Estimated Value: $1,383,405 - $1,744,000
2
Beds
3
Baths
1,261
Sq Ft
$1,214/Sq Ft
Est. Value
About This Home
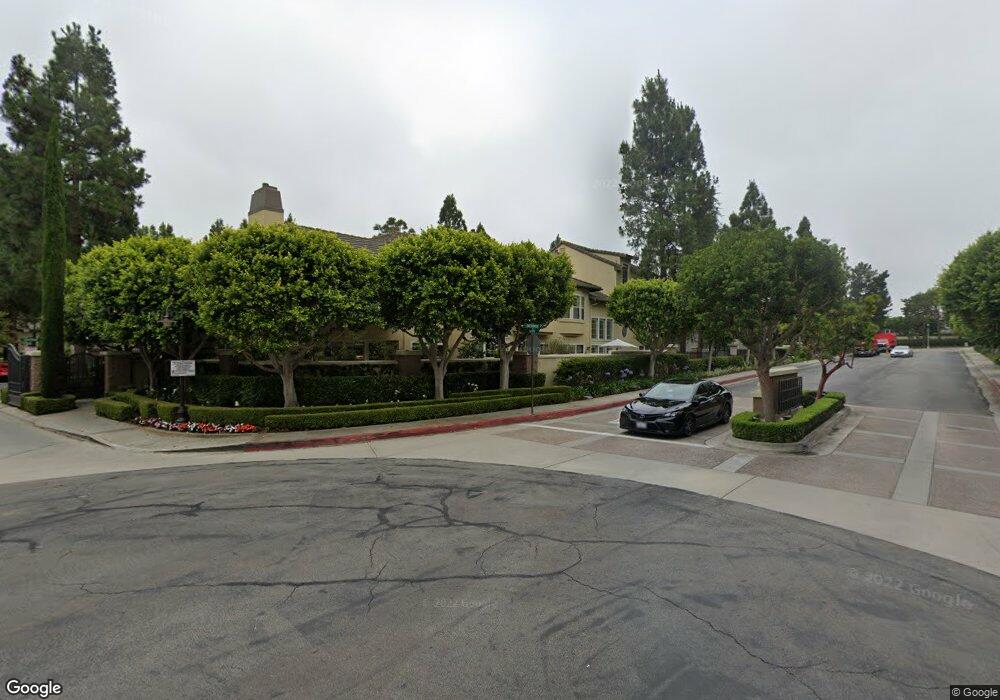
This home is located at 73 Anjou, Newport Coast, CA 92657 and is currently estimated at $1,530,601, approximately $1,213 per square foot. 73 Anjou is a home located in Orange County with nearby schools including Newport Coast Elementary School, Corona del Mar Middle and High School, and Harbor Day School.
Ownership History
Date
Name
Owned For
Owner Type
Purchase Details
Closed on
Feb 16, 2011
Sold by
Stirling Lydia
Bought by
Chang Yoon O and Chang Angela M
Current Estimated Value
Home Financials for this Owner
Home Financials are based on the most recent Mortgage that was taken out on this home.
Original Mortgage
$404,000
Outstanding Balance
$275,000
Interest Rate
4.67%
Mortgage Type
New Conventional
Estimated Equity
$1,255,601
Purchase Details
Closed on
Feb 14, 2005
Sold by
Sawyer Tom T
Bought by
Stirling Lydia
Home Financials for this Owner
Home Financials are based on the most recent Mortgage that was taken out on this home.
Original Mortgage
$607,200
Interest Rate
5%
Mortgage Type
Purchase Money Mortgage
Purchase Details
Closed on
Feb 19, 2002
Sold by
Realica Raquel M
Bought by
Sawyer Tom T
Home Financials for this Owner
Home Financials are based on the most recent Mortgage that was taken out on this home.
Original Mortgage
$335,760
Interest Rate
6%
Purchase Details
Closed on
Mar 6, 2000
Sold by
Tung George C
Bought by
Realica Raquel M
Home Financials for this Owner
Home Financials are based on the most recent Mortgage that was taken out on this home.
Original Mortgage
$314,700
Interest Rate
4.95%
Purchase Details
Closed on
Sep 17, 1996
Sold by
Michael Tator and Michael Julie
Bought by
Tung George C
Home Financials for this Owner
Home Financials are based on the most recent Mortgage that was taken out on this home.
Original Mortgage
$178,400
Interest Rate
7.75%
Purchase Details
Closed on
Dec 6, 1994
Sold by
Lewis Homes Of California
Bought by
Tator Michael S and Tator Julie R
Home Financials for this Owner
Home Financials are based on the most recent Mortgage that was taken out on this home.
Original Mortgage
$151,100
Interest Rate
9.28%
Create a Home Valuation Report for This Property
The Home Valuation Report is an in-depth analysis detailing your home's value as well as a comparison with similar homes in the area
Home Values in the Area
Average Home Value in this Area
Purchase History
| Date | Buyer | Sale Price | Title Company |
|---|---|---|---|
| Chang Yoon O | $505,000 | Stewart Title | |
| Stirling Lydia | $759,000 | Equity Title Company | |
| Sawyer Tom T | $420,000 | California Title Company | |
| Realica Raquel M | $350,000 | First American Title Ins Co | |
| Tung George C | $223,000 | Orange Coast Title | |
| Tator Michael S | $216,000 | Orange Coast Title |
Source: Public Records
Mortgage History
| Date | Status | Borrower | Loan Amount |
|---|---|---|---|
| Open | Chang Yoon O | $404,000 | |
| Previous Owner | Stirling Lydia | $607,200 | |
| Previous Owner | Sawyer Tom T | $335,760 | |
| Previous Owner | Realica Raquel M | $314,700 | |
| Previous Owner | Tung George C | $178,400 | |
| Previous Owner | Tator Michael S | $151,100 |
Source: Public Records
Tax History Compared to Growth
Tax History
| Year | Tax Paid | Tax Assessment Tax Assessment Total Assessment is a certain percentage of the fair market value that is determined by local assessors to be the total taxable value of land and additions on the property. | Land | Improvement |
|---|---|---|---|---|
| 2025 | $6,741 | $646,989 | $451,996 | $194,993 |
| 2024 | $6,741 | $634,303 | $443,133 | $191,170 |
| 2023 | $6,662 | $621,866 | $434,444 | $187,422 |
| 2022 | $6,549 | $609,673 | $425,925 | $183,748 |
| 2021 | $5,607 | $597,719 | $417,573 | $180,146 |
| 2020 | $6,347 | $591,591 | $413,292 | $178,299 |
| 2019 | $6,276 | $579,992 | $405,189 | $174,803 |
| 2018 | $6,151 | $568,620 | $397,244 | $171,376 |
| 2017 | $6,044 | $557,471 | $389,455 | $168,016 |
| 2016 | $5,843 | $546,541 | $381,819 | $164,722 |
| 2015 | $5,788 | $538,332 | $376,084 | $162,248 |
| 2014 | $5,961 | $527,787 | $368,717 | $159,070 |
Source: Public Records
Map
Nearby Homes