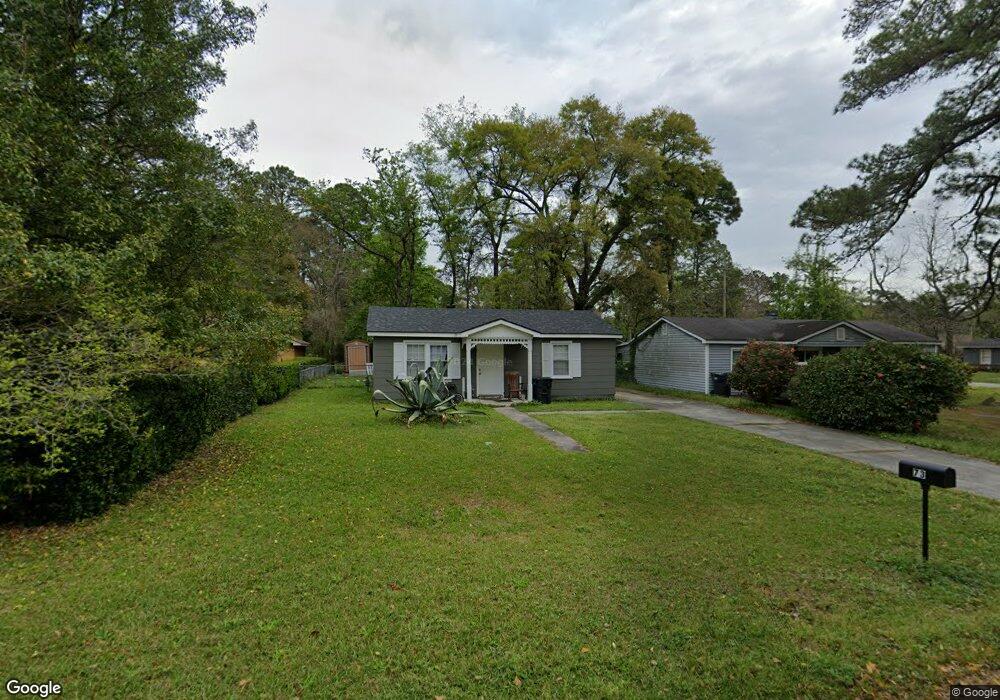
73 Belmont St Savannah, GA 31406
Norwood-Wylly Island NeighborhoodEstimated Value: $120,000 - $207,000
2
Beds
1
Bath
834
Sq Ft
$207/Sq Ft
Est. Value
About This Home
This home is located at 73 Belmont St, Savannah, GA 31406 and is currently estimated at $172,463, approximately $206 per square foot. 73 Belmont St is a home located in Chatham County with nearby schools including Isle Of Hope School, Johnson High School, and Oglethorpe Charter School.
Ownership History
Date
Name
Owned For
Owner Type
Purchase Details
Closed on
Apr 3, 2019
Sold by
Kicklighter John A
Bought by
73 Belmont Drive Llc
Current Estimated Value
Purchase Details
Closed on
Mar 22, 2018
Sold by
Anchors David W
Bought by
Kicklighter John A
Purchase Details
Closed on
May 2, 2007
Sold by
Not Provided
Bought by
Anchors David W
Home Financials for this Owner
Home Financials are based on the most recent Mortgage that was taken out on this home.
Original Mortgage
$64,150
Interest Rate
6.12%
Mortgage Type
New Conventional
Create a Home Valuation Report for This Property
The Home Valuation Report is an in-depth analysis detailing your home's value as well as a comparison with similar homes in the area
Home Values in the Area
Average Home Value in this Area
Purchase History
| Date | Buyer | Sale Price | Title Company |
|---|---|---|---|
| 73 Belmont Drive Llc | -- | -- | |
| Kicklighter John A | $42,383 | -- | |
| Anchors David W | $67,000 | -- |
Source: Public Records
Mortgage History
| Date | Status | Borrower | Loan Amount |
|---|---|---|---|
| Previous Owner | Anchors David W | $64,150 |
Source: Public Records
Tax History Compared to Growth
Tax History
| Year | Tax Paid | Tax Assessment Tax Assessment Total Assessment is a certain percentage of the fair market value that is determined by local assessors to be the total taxable value of land and additions on the property. | Land | Improvement |
|---|---|---|---|---|
| 2025 | $840 | $20,040 | $14,400 | $5,640 |
| 2024 | $840 | $20,040 | $14,400 | $5,640 |
| 2023 | $760 | $20,040 | $14,400 | $5,640 |
| 2022 | $604 | $16,953 | $14,400 | $2,553 |
| 2021 | $689 | $16,953 | $14,400 | $2,553 |
| 2020 | $619 | $19,520 | $14,400 | $5,120 |
| 2019 | $704 | $16,954 | $12,766 | $4,188 |
| 2018 | $707 | $23,600 | $14,400 | $9,200 |
| 2017 | $698 | $20,840 | $14,400 | $6,440 |
| 2016 | $741 | $20,960 | $14,400 | $6,560 |
| 2015 | $753 | $21,280 | $14,400 | $6,880 |
| 2014 | $1,424 | $28,040 | $0 | $0 |
Source: Public Records
Map
Nearby Homes
- 111 S Robinhood Dr
- 2511 Little John Ct
- 19 Arline Dr
- 4 Cross Bow Ct
- 7206 Garfield St
- 7014 Key St
- 20 Lansing Ave Unit C
- 7216 Garfield St
- 19 Robin Hood Dr
- 9 Mulberry Ct
- 0 Skinner Place
- 0 Skinner Place Unit 10588694
- 7308 Garfield St
- 3 Brighton Way
- 102 Hope Ln Unit B
- 117 Hope Ln Unit A
- 7 Bakers Crossing
- 6929 Key St
- 0 Albert St Unit SA337026
- 109 Canter Ct
- 74 Belmont St
- 72 Belmont St
- 0 Belmont St Unit 7479167
- 0 Belmont St Unit 7195157
- 0 Belmont St
- 71 Superior Ave
- 76 Belmont St
- 77 Belmont St
- 70 Superior Ave
- 81 Superior Ave
- 78 Belmont St
- 83 Superior Ave
- 84 Superior Ave
- 69 Superior Ave
- 158 Neva Ave
- 156 Neva Ave
- 79 Belmont St
- 67 Hily Ave
- 154 Neva Ave
- 152 Neva Ave