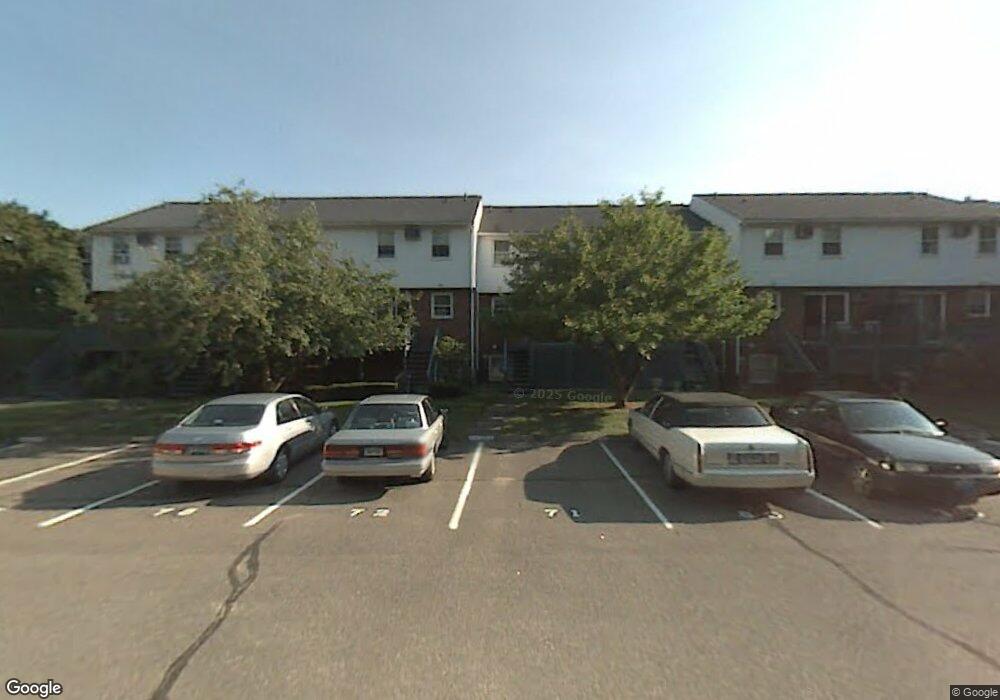
73 Brandywine Ln Suffield, CT 06078
Estimated Value: $226,763 - $341,000
2
Beds
2
Baths
1,116
Sq Ft
$241/Sq Ft
Est. Value
About This Home
This home is located at 73 Brandywine Ln, Suffield, CT 06078 and is currently estimated at $269,441, approximately $241 per square foot. 73 Brandywine Ln is a home located in Hartford County with nearby schools including A. Ward Spaulding School, Mcalister Intermediate School, and Suffield Middle School.
Ownership History
Date
Name
Owned For
Owner Type
Purchase Details
Closed on
Aug 27, 2019
Sold by
Taniwha Sara L
Bought by
Dejesus Alexandry
Current Estimated Value
Home Financials for this Owner
Home Financials are based on the most recent Mortgage that was taken out on this home.
Original Mortgage
$147,283
Interest Rate
3.62%
Mortgage Type
FHA
Purchase Details
Closed on
Jul 17, 2008
Sold by
Murray Matthew and Murray Bridgid
Bought by
Thompson Kimberly
Home Financials for this Owner
Home Financials are based on the most recent Mortgage that was taken out on this home.
Original Mortgage
$149,150
Interest Rate
6.17%
Purchase Details
Closed on
Jul 2, 2003
Sold by
Schofield Lydia
Bought by
Murray Matthew and Tyler Bridgid
Home Financials for this Owner
Home Financials are based on the most recent Mortgage that was taken out on this home.
Original Mortgage
$95,000
Interest Rate
5.46%
Purchase Details
Closed on
Jul 17, 2000
Sold by
Preis Raymond
Bought by
Schofield Frederick
Create a Home Valuation Report for This Property
The Home Valuation Report is an in-depth analysis detailing your home's value as well as a comparison with similar homes in the area
Home Values in the Area
Average Home Value in this Area
Purchase History
| Date | Buyer | Sale Price | Title Company |
|---|---|---|---|
| Dejesus Alexandry | $150,000 | None Available | |
| Thompson Kimberly | $157,000 | -- | |
| Thompson Kimberly | $157,000 | -- | |
| Murray Matthew | $118,750 | -- | |
| Murray Matthew | $118,750 | -- | |
| Schofield Frederick | $89,000 | -- | |
| Schofield Frederick | $89,000 | -- |
Source: Public Records
Mortgage History
| Date | Status | Borrower | Loan Amount |
|---|---|---|---|
| Previous Owner | Dejesus Alexandry | $147,283 | |
| Previous Owner | Schofield Frederick | $149,150 | |
| Previous Owner | Schofield Frederick | $95,000 |
Source: Public Records
Tax History
| Year | Tax Paid | Tax Assessment Tax Assessment Total Assessment is a certain percentage of the fair market value that is determined by local assessors to be the total taxable value of land and additions on the property. | Land | Improvement |
|---|---|---|---|---|
| 2025 | $2,669 | $114,030 | $0 | $114,030 |
| 2024 | $2,580 | $114,030 | $0 | $114,030 |
| 2023 | $2,573 | $89,950 | $0 | $89,950 |
| 2022 | $2,573 | $89,950 | $0 | $89,950 |
| 2021 | $2,576 | $89,950 | $0 | $89,950 |
| 2020 | $2,576 | $89,950 | $0 | $89,950 |
| 2019 | $2,583 | $89,950 | $0 | $89,950 |
| 2018 | $2,715 | $92,610 | $0 | $92,610 |
| 2017 | $2,676 | $92,610 | $0 | $92,610 |
| 2016 | $2,612 | $92,610 | $0 | $92,610 |
| 2015 | $2,573 | $92,610 | $0 | $92,610 |
| 2014 | $2,512 | $92,610 | $0 | $92,610 |
Source: Public Records
Map
Nearby Homes
- 424 Bridge St
- 0 Stone St S Unit 24039713
- 0 Suffield St Unit 24093452
- 0 Suffield St Unit 24057050
- 1 E Elaine Dr
- 18 Daniel Cir Unit 18
- 713 Thrall Ave
- 779 Bridge St
- 15 Downing Way
- 485 Mountain Rd
- 278 Thompsonville Rd
- 120 2nd St
- 98 1st St
- 72 Spencer St
- 4 Pebblestone Cir
- 315 East St S
- 687 East St S
- 155 Mountain Laurel Way
- 24 Pebblestone Cir Unit 24
- 660 East St S
- 81 Brandywine Ln
- 80 Brandywine Ln
- 79 Brandywine Ln
- 78 Brandywine Ln
- 77 Brandywine Ln
- 76 Brandywine Ln
- 75 Brandywine Ln
- 74 Brandywine Ln
- 72 Brandywine Ln
- 71 Brandywine Ln
- 70 Brandywine Ln
- 69 Brandywine Ln
- 68 Brandywine Ln
- 67 Brandywine Ln
- 67 Brandywine Ln Unit 67
- 77 Brandywine Ln Unit 77
- 69 Brandywine Ln Unit 69
- 81 Brandywine Ln Unit 81
- 73 Brandywine Ln Unit 73
- 80 Brandywine Ln Unit 80
Your Personal Tour Guide
Ask me questions while you tour the home.