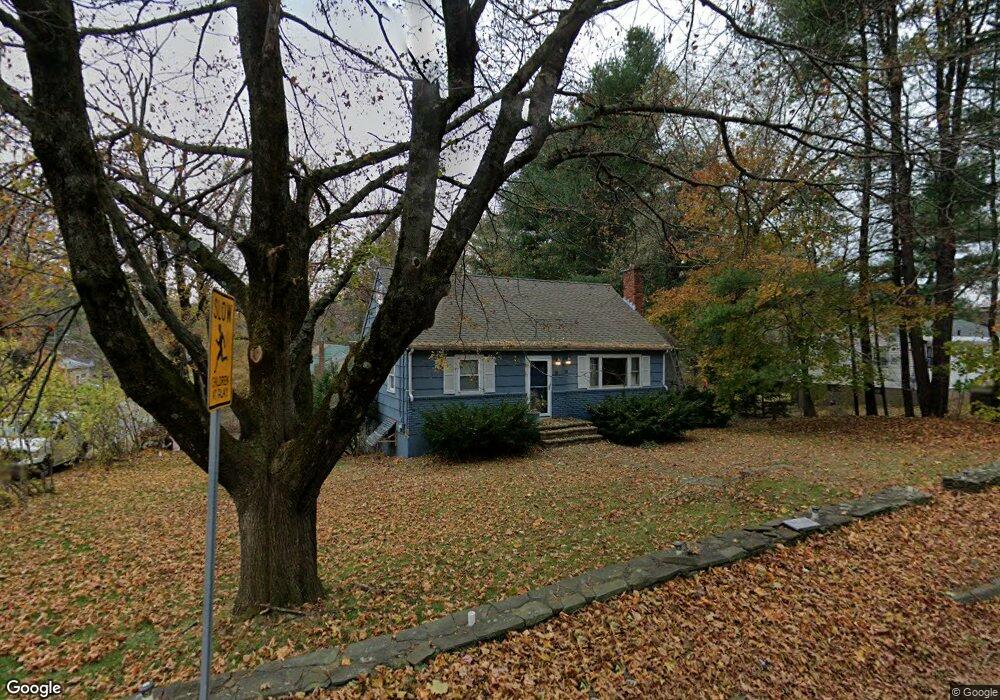
73 Causeway St Hudson, MA 01749
Estimated Value: $533,000 - $623,000
3
Beds
2
Baths
1,505
Sq Ft
$385/Sq Ft
Est. Value
About This Home
This home is located at 73 Causeway St, Hudson, MA 01749 and is currently estimated at $579,478, approximately $385 per square foot. 73 Causeway St is a home located in Middlesex County with nearby schools including David J. Quinn Middle School, Hudson High School, and First Steps Children's Center.
Ownership History
Date
Name
Owned For
Owner Type
Purchase Details
Closed on
Nov 22, 2021
Sold by
Magee Jacob W Est
Bought by
Magee Jacob W
Current Estimated Value
Purchase Details
Closed on
Mar 13, 2003
Sold by
Magee Evan A
Bought by
Magee Sue E and Magee Evan A
Home Financials for this Owner
Home Financials are based on the most recent Mortgage that was taken out on this home.
Original Mortgage
$82,000
Interest Rate
5.94%
Purchase Details
Closed on
Dec 17, 1990
Sold by
Spinelli Raymond J
Bought by
Magee Evan A
Home Financials for this Owner
Home Financials are based on the most recent Mortgage that was taken out on this home.
Original Mortgage
$92,250
Interest Rate
10.07%
Mortgage Type
Purchase Money Mortgage
Create a Home Valuation Report for This Property
The Home Valuation Report is an in-depth analysis detailing your home's value as well as a comparison with similar homes in the area
Home Values in the Area
Average Home Value in this Area
Purchase History
| Date | Buyer | Sale Price | Title Company |
|---|---|---|---|
| Magee Jacob W | -- | None Available | |
| Magee Jacob W | -- | None Available | |
| Magee Sue E | -- | -- | |
| Magee Sue E | -- | -- | |
| Magee Evan A | $123,000 | -- |
Source: Public Records
Mortgage History
| Date | Status | Borrower | Loan Amount |
|---|---|---|---|
| Previous Owner | Magee Sue E | $82,000 | |
| Previous Owner | Magee Evan A | $5,000 | |
| Previous Owner | Magee Evan A | $92,000 | |
| Previous Owner | Magee Evan A | $92,250 |
Source: Public Records
Tax History Compared to Growth
Tax History
| Year | Tax Paid | Tax Assessment Tax Assessment Total Assessment is a certain percentage of the fair market value that is determined by local assessors to be the total taxable value of land and additions on the property. | Land | Improvement |
|---|---|---|---|---|
| 2025 | $6,969 | $502,100 | $186,200 | $315,900 |
| 2024 | $6,668 | $476,300 | $169,400 | $306,900 |
| 2023 | $6,260 | $428,800 | $162,900 | $265,900 |
| 2022 | $5,757 | $363,000 | $147,900 | $215,100 |
| 2021 | $5,700 | $343,600 | $140,900 | $202,700 |
| 2020 | $5,925 | $356,700 | $138,200 | $218,500 |
| 2019 | $5,569 | $327,000 | $138,200 | $188,800 |
| 2018 | $5,376 | $307,200 | $131,700 | $175,500 |
| 2017 | $5,003 | $285,900 | $125,300 | $160,600 |
| 2016 | $4,661 | $269,600 | $125,300 | $144,300 |
| 2015 | $4,297 | $248,800 | $125,300 | $123,500 |
| 2014 | $4,177 | $239,800 | $109,900 | $129,900 |
Source: Public Records
Map
Nearby Homes
- 18 Collins Dr
- 16 Abigail Dr
- 9 & 9A Abigail
- 7 Old North Rd
- 7e Strawberry Ln Unit E
- 24 Seneca Dr
- 68 Upland Rd
- 46 Jewell Rd Unit Lot 5
- 44 Jewell Rd Unit Lot 4
- 30 Jewell Rd Unit Lot 2
- 502 Hosmer St
- 425 Main St Unit 11B
- 20 Beauregard Cir
- 33A Russo Dr
- 56 Forest Ave
- 114 Lodi Rd
- 304 Cox St
- 34 Forest Ave
- 11 Barracks Rd Unit 11
- 9 Barracks Rd Unit 9