
Landlord's Agent in 2024
Orna Jackson
Prominent Properties Sotheby's International Realty-Tenafly
(201) 376-1389
44 in this area
163 Total Sales
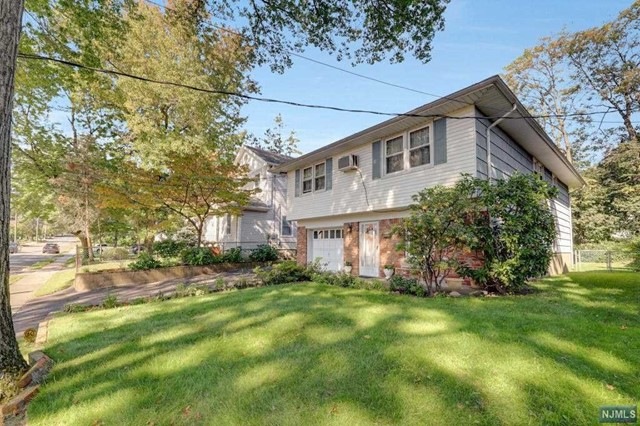
Estimated Value: $882,000 - $1,091,000
Leased OE
Last Agent to Rent the Property
Prominent Properties Sotheby's International Realty-Tenafly Listed on: 04/02/2024
Last Renter's Agent
Prominent Properties Sotheby's International Realty-Tenafly Listed on: 04/02/2024
| Date | Buyer | Sale Price | Title Company |
|---|---|---|---|
| Kore Miriam | $790,000 | None Listed On Document | |
| Savva Efrosini M | -- | None Available |
| Date | Status | Borrower | Loan Amount |
|---|---|---|---|
| Previous Owner | Savva Efrosini M | $796,500 |
| Date | Event | Price | List to Sale | Price per Sq Ft | Prior Sale |
|---|---|---|---|---|---|
| 04/02/2024 04/02/24 | Rented | $5,500 | 0.0% | -- | |
| 04/02/2024 04/02/24 | For Rent | $5,500 | 0.0% | -- | |
| 03/01/2024 03/01/24 | Sold | $790,000 | +10.0% | $368 / Sq Ft | View Prior Sale |
| 10/25/2023 10/25/23 | Pending | -- | -- | -- | |
| 10/05/2023 10/05/23 | For Sale | $718,000 | -- | $335 / Sq Ft |
| Year | Tax Paid | Tax Assessment Tax Assessment Total Assessment is a certain percentage of the fair market value that is determined by local assessors to be the total taxable value of land and additions on the property. | Land | Improvement |
|---|---|---|---|---|
| 2025 | $13,398 | $477,500 | $296,000 | $181,500 |
| 2024 | $13,073 | $471,600 | $296,000 | $175,600 |
| 2023 | $12,507 | $471,600 | $296,000 | $175,600 |
| 2022 | $12,757 | $471,600 | $296,000 | $175,600 |
| 2021 | $11,371 | $471,600 | $296,000 | $175,600 |
| 2020 | $12,346 | $471,600 | $296,000 | $175,600 |
| 2019 | $12,130 | $471,600 | $296,000 | $175,600 |
| 2018 | $11,941 | $471,600 | $296,000 | $175,600 |
| 2017 | $11,898 | $471,600 | $296,000 | $175,600 |
| 2016 | $11,663 | $471,600 | $296,000 | $175,600 |
| 2015 | $11,153 | $471,600 | $296,000 | $175,600 |
| 2014 | $10,941 | $471,600 | $296,000 | $175,600 |
Landlord's Agent in 2024
Orna Jackson
Prominent Properties Sotheby's International Realty-Tenafly
(201) 376-1389
44 in this area
163 Total Sales
S
Seller's Agent in 2024
Sotiroula Savva
Prominent Properties Sotheby's International Realty-Tenafly
(201) 805-9861
1 in this area
11 Total Sales
Source: New Jersey MLS
MLS Number: 24010595
APN: 61-01208-0000-00014
Disclaimer: Certain information contained herein is derived from information provided by parties other than Homes.com. All information provided is deemed reliable, but is not guaranteed to be accurate and should be independently verified.
![]() The data relating to the real estate for sale on this web site comes in part from the Internet Data Exchange Program of the NJMLS. Real estate listings held by brokerage firms other than Ten-X are marked with the Internet Data Exchange logo and information about them includes the name of the listing brokers. Some properties listed with the participating brokers do not appear on this website at the request of the seller. Listings of brokers that do not participate in Internet Data Exchange do not appear on this website.
The data relating to the real estate for sale on this web site comes in part from the Internet Data Exchange Program of the NJMLS. Real estate listings held by brokerage firms other than Ten-X are marked with the Internet Data Exchange logo and information about them includes the name of the listing brokers. Some properties listed with the participating brokers do not appear on this website at the request of the seller. Listings of brokers that do not participate in Internet Data Exchange do not appear on this website.
All information deemed reliable but not guaranteed. Source: New Jersey Multiple Listing, Inc.
© 2025 New Jersey Multiple Listing Service Inc. All rights reserved.