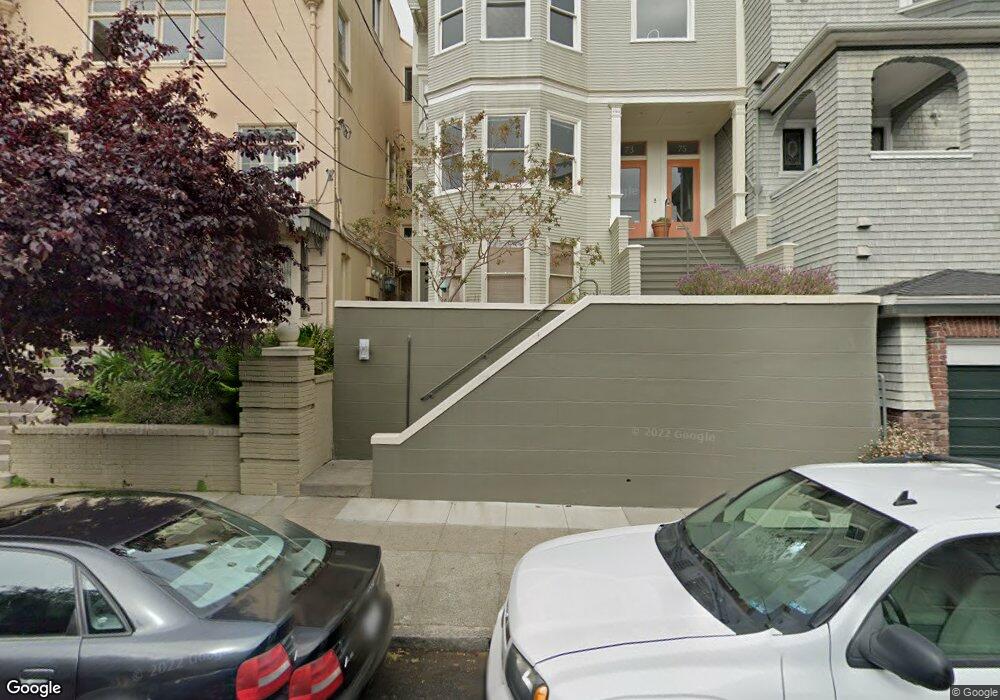
73 Divisadero St Unit 75 San Francisco, CA 94117
Buena Vista/Ashbury Heights NeighborhoodEstimated Value: $1,828,000 - $3,047,439
--
Bed
2
Baths
2,488
Sq Ft
$964/Sq Ft
Est. Value
About This Home
This home is located at 73 Divisadero St Unit 75, San Francisco, CA 94117 and is currently estimated at $2,398,360, approximately $963 per square foot. 73 Divisadero St Unit 75 is a home located in San Francisco County with nearby schools including McKinley Elementary School, Everett Middle School, and Mission Dolores Academy.
Ownership History
Date
Name
Owned For
Owner Type
Purchase Details
Closed on
Nov 3, 2020
Sold by
Ehr Nicolas and Ho Yalek
Bought by
Ehr Nicolas J and Ho Yalek M
Current Estimated Value
Purchase Details
Closed on
Feb 4, 2015
Sold by
Hill Lisa Larsen
Bought by
Ehr Nicolas J
Purchase Details
Closed on
Jun 4, 2008
Sold by
Ehr Nic
Bought by
Ehr Nicolas J
Purchase Details
Closed on
Jan 22, 1998
Sold by
Nic Ehr and Nic Lisa Larsen
Bought by
Ehr Nic and Hill Lisa Larsen
Home Financials for this Owner
Home Financials are based on the most recent Mortgage that was taken out on this home.
Original Mortgage
$411,500
Interest Rate
6.87%
Mortgage Type
Commercial
Purchase Details
Closed on
Mar 25, 1994
Sold by
Schaefer David
Bought by
Ehr Nic and Larsen Lisa
Home Financials for this Owner
Home Financials are based on the most recent Mortgage that was taken out on this home.
Original Mortgage
$423,750
Interest Rate
5.5%
Mortgage Type
Commercial
Create a Home Valuation Report for This Property
The Home Valuation Report is an in-depth analysis detailing your home's value as well as a comparison with similar homes in the area
Home Values in the Area
Average Home Value in this Area
Purchase History
| Date | Buyer | Sale Price | Title Company |
|---|---|---|---|
| Ehr Nicolas J | -- | None Available | |
| Ehr Nicolas | -- | None Available | |
| Ehr Nicolas J | $720,000 | Old Republic Title Company | |
| Ehr Nicolas J | -- | None Available | |
| Ehr Nic | -- | Fidelity National Title Co | |
| Hill Lisa Larsen | -- | Fidelity National Title Co | |
| Ehr Nic | -- | Stewart Title Company |
Source: Public Records
Mortgage History
| Date | Status | Borrower | Loan Amount |
|---|---|---|---|
| Previous Owner | Ehr Nic | $411,500 | |
| Previous Owner | Ehr Nic | $423,750 |
Source: Public Records
Tax History Compared to Growth
Tax History
| Year | Tax Paid | Tax Assessment Tax Assessment Total Assessment is a certain percentage of the fair market value that is determined by local assessors to be the total taxable value of land and additions on the property. | Land | Improvement |
|---|---|---|---|---|
| 2025 | $22,239 | $1,924,849 | $1,237,713 | $686,964 |
| 2024 | $22,239 | $1,887,160 | $1,213,445 | $673,495 |
| 2023 | $21,921 | $1,850,207 | $1,189,653 | $660,290 |
| 2022 | $21,531 | $1,813,952 | $1,166,328 | $647,344 |
| 2021 | $21,161 | $1,778,512 | $1,143,460 | $635,052 |
| 2020 | $21,141 | $1,760,082 | $1,131,736 | $628,346 |
| 2019 | $20,411 | $1,725,577 | $1,109,546 | $616,031 |
| 2018 | $20,374 | $1,691,749 | $1,087,792 | $603,957 |
| 2017 | $19,835 | $1,658,582 | $1,066,463 | $592,119 |
| 2016 | $19,527 | $1,762,517 | $1,141,068 | $621,449 |
| 2015 | $8,074 | $660,501 | $285,125 | $375,376 |
| 2014 | $7,860 | $647,569 | $279,541 | $368,028 |
Source: Public Records
Map
Nearby Homes
- 146 Henry St
- 171 Buena Vista Ave E Unit 173
- 167 Divisadero St
- 351 Buena Vista Ave E Unit 605E
- 141 Buena Vista Ave E Unit 143
- 141-143 Buena Vista Ave E
- 143 Buena Vista Ave E
- 28 Flint St
- 226 Roosevelt Way Unit A
- 260 Castro St
- 262 Castro St
- 22 Beaver St
- 223 Divisadero St
- 12 Beaver St
- 863 Haight St Unit 5
- 3775 16th St
- 2152 15th St
- 1059 Haight St
- 972 Haight St
- 2260 Market St
- 79 Divisadero St
- 69 Divisadero St Unit 69
- 67 Divisadero St
- 83 Divisadero St
- 133 Alpine Terrace
- 125 Alpine Terrace
- 815 Duboce Ave
- 821 Duboce Ave
- 143 Alpine Terrace
- 99 Divisadero St
- 141 Alpine Terrace Unit 141
- 827 Duboce Ave
- 53 Divisadero St
- 117 Alpine Terrace
- 121 Alpine Terrace
- 145 Alpine Terrace
- 115 Alpine Terrace
- 70 Divisadero St Unit A
- 82 Divisadero St Unit 84
- 49 Divisadero St