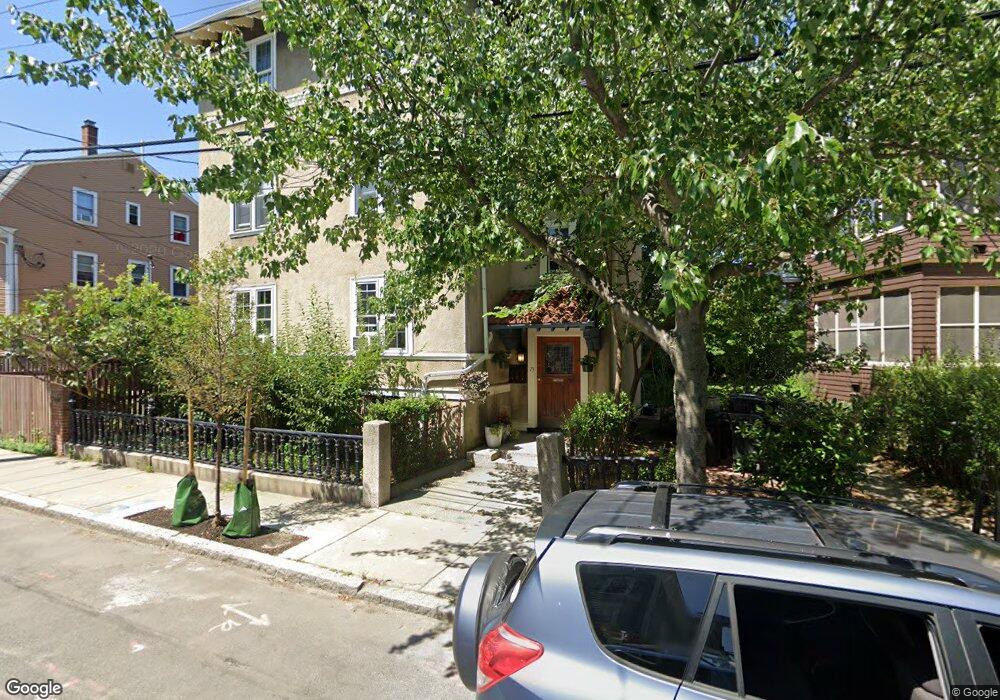
73 Fayette St Unit 3 Cambridge, MA 02139
Mid-Cambridge NeighborhoodEstimated Value: $1,208,000 - $1,232,000
3
Beds
1
Bath
1,353
Sq Ft
$901/Sq Ft
Est. Value
About This Home
This home is located at 73 Fayette St Unit 3, Cambridge, MA 02139 and is currently estimated at $1,218,527, approximately $900 per square foot. 73 Fayette St Unit 3 is a home located in Middlesex County with nearby schools including Prospect Hill Academy Charter School and Saint Paul's Choir School.
Ownership History
Date
Name
Owned For
Owner Type
Purchase Details
Closed on
Jun 17, 2011
Sold by
Celimli Evren and Celimli Allison
Bought by
Rooney 3Rd Edward S and Partilla Maggie E
Current Estimated Value
Home Financials for this Owner
Home Financials are based on the most recent Mortgage that was taken out on this home.
Original Mortgage
$402,750
Outstanding Balance
$279,077
Interest Rate
4.74%
Mortgage Type
Purchase Money Mortgage
Estimated Equity
$939,450
Purchase Details
Closed on
Oct 18, 2004
Sold by
Ferriday Virgina Guest
Bought by
Celimli Allison and Celimli Evren
Home Financials for this Owner
Home Financials are based on the most recent Mortgage that was taken out on this home.
Original Mortgage
$150,000
Interest Rate
5.8%
Mortgage Type
Purchase Money Mortgage
Purchase Details
Closed on
Apr 18, 1989
Sold by
Barkow Barry
Bought by
Ferriday Virginia G
Home Financials for this Owner
Home Financials are based on the most recent Mortgage that was taken out on this home.
Original Mortgage
$180,000
Interest Rate
10.85%
Mortgage Type
Purchase Money Mortgage
Create a Home Valuation Report for This Property
The Home Valuation Report is an in-depth analysis detailing your home's value as well as a comparison with similar homes in the area
Home Values in the Area
Average Home Value in this Area
Purchase History
| Date | Buyer | Sale Price | Title Company |
|---|---|---|---|
| Rooney 3Rd Edward S | $537,000 | -- | |
| Celimli Allison | $500,000 | -- | |
| Ferriday Virginia G | $225,000 | -- | |
| Ferriday Virginia G | $225,000 | -- |
Source: Public Records
Mortgage History
| Date | Status | Borrower | Loan Amount |
|---|---|---|---|
| Open | Rooney 3Rd Edward S | $402,750 | |
| Previous Owner | Celimli Allison | $150,000 | |
| Previous Owner | Ferriday Virginia G | $10,000 | |
| Previous Owner | Ferriday Virginia G | $180,000 |
Source: Public Records
Tax History Compared to Growth
Tax History
| Year | Tax Paid | Tax Assessment Tax Assessment Total Assessment is a certain percentage of the fair market value that is determined by local assessors to be the total taxable value of land and additions on the property. | Land | Improvement |
|---|---|---|---|---|
| 2025 | $6,659 | $1,048,600 | $0 | $1,048,600 |
| 2024 | $6,144 | $1,037,800 | $0 | $1,037,800 |
| 2023 | $5,769 | $984,500 | $0 | $984,500 |
| 2022 | $5,746 | $970,600 | $0 | $970,600 |
| 2021 | $5,624 | $961,400 | $0 | $961,400 |
| 2020 | $5,311 | $923,700 | $0 | $923,700 |
| 2019 | $5,084 | $855,900 | $0 | $855,900 |
| 2018 | $5,063 | $784,400 | $0 | $784,400 |
| 2017 | $4,758 | $733,200 | $0 | $733,200 |
| 2016 | $4,632 | $662,600 | $0 | $662,600 |
| 2015 | $4,579 | $585,600 | $0 | $585,600 |
| 2014 | $4,376 | $522,200 | $0 | $522,200 |
Source: Public Records
Map
Nearby Homes
- 75 Fayette St Unit 3
- 114 Inman St Unit 3
- 142 Amory St Unit Front
- 63 Oak St Unit 3
- 63 Oak St Unit 2
- 31 Houghton St Unit B
- 31 Houghton St Unit A
- 54 Oak St
- 5 Waldo Ave Unit 2A
- 73 Marion St Unit 2
- 97 Beacon St
- 33 Line St Unit 1
- 106 Ellery St
- 196 Prospect St
- 31 Tremont St
- 190 Prospect St Unit 8
- 80 Newton St Unit 2
- 13 Roberts Rd
- 8 Chatham St Unit 4
- 392 Norfolk St Unit 1
- 73 Fayette St Unit 2
- 73 Fayette St Unit 1
- 69 Fayette St
- 65 Fayette St
- 75 Fayette St Unit 2
- 75 Fayette St Unit 1
- 61 Fayette St Unit 10
- 61 Fayette St Unit 2
- 61 Fayette St Unit 3
- 61 Fayette St Unit 11
- 61 Fayette St Unit 14
- 61 Fayette St Unit 7
- 61 Fayette St Unit 1
- 61 Fayette St
- 61 Fayette St Unit 4
- 61 Fayette St Unit 8
- 6 Fainwood Cir Unit 3
- 6 Fainwood Cir Unit 2
- 6 Fainwood Cir Unit 1
- 1446 Cambridge St