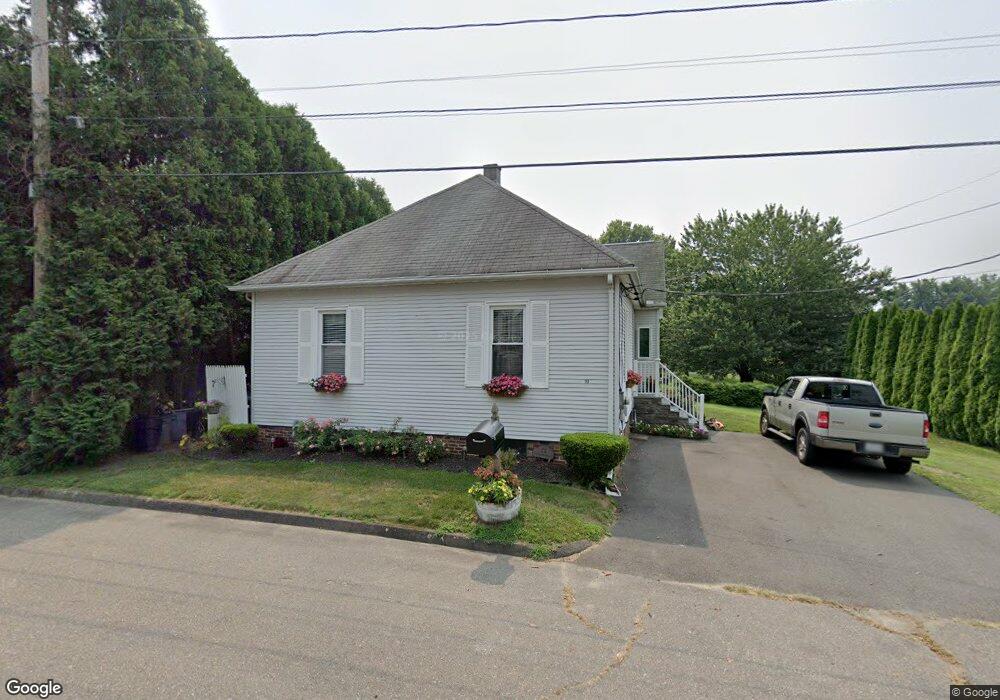
73 Frederick St Chicopee, MA 01013
Willimansett NeighborhoodEstimated Value: $281,446 - $312,000
3
Beds
1
Bath
1,326
Sq Ft
$227/Sq Ft
Est. Value
About This Home
This home is located at 73 Frederick St, Chicopee, MA 01013 and is currently estimated at $300,862, approximately $226 per square foot. 73 Frederick St is a home located in Hampden County with nearby schools including Stefanik Elementary School, Bellamy Middle School, and Chicopee High School.
Ownership History
Date
Name
Owned For
Owner Type
Purchase Details
Closed on
Feb 2, 1999
Sold by
73 Frederick St Rt
Bought by
Bailey Thomas C and Bailey Roberta
Current Estimated Value
Home Financials for this Owner
Home Financials are based on the most recent Mortgage that was taken out on this home.
Original Mortgage
$2,777
Interest Rate
6.78%
Create a Home Valuation Report for This Property
The Home Valuation Report is an in-depth analysis detailing your home's value as well as a comparison with similar homes in the area
Home Values in the Area
Average Home Value in this Area
Purchase History
| Date | Buyer | Sale Price | Title Company |
|---|---|---|---|
| Bailey Thomas C | $91,250 | -- |
Source: Public Records
Mortgage History
| Date | Status | Borrower | Loan Amount |
|---|---|---|---|
| Open | Bailey Thomas C | $123,482 | |
| Closed | Bailey Thomas C | $2,777 | |
| Closed | Bailey Thomas C | $90,700 | |
| Previous Owner | Bailey Thomas C | $15,000 |
Source: Public Records
Tax History
| Year | Tax Paid | Tax Assessment Tax Assessment Total Assessment is a certain percentage of the fair market value that is determined by local assessors to be the total taxable value of land and additions on the property. | Land | Improvement |
|---|---|---|---|---|
| 2025 | $3,293 | $217,200 | $81,200 | $136,000 |
| 2024 | $3,123 | $211,600 | $79,700 | $131,900 |
| 2023 | $2,922 | $192,900 | $72,400 | $120,500 |
| 2022 | $2,786 | $164,000 | $63,000 | $101,000 |
| 2021 | $2,622 | $148,900 | $57,200 | $91,700 |
| 2020 | $2,492 | $142,700 | $57,200 | $85,500 |
| 2019 | $2,455 | $136,700 | $57,200 | $79,500 |
| 2018 | $2,378 | $129,900 | $54,500 | $75,400 |
| 2017 | $2,382 | $137,600 | $54,500 | $83,100 |
| 2016 | $2,278 | $134,700 | $54,500 | $80,200 |
| 2015 | $2,368 | $135,000 | $54,500 | $80,500 |
| 2014 | $1,184 | $135,000 | $54,500 | $80,500 |
Source: Public Records
Map
Nearby Homes
- 51 Beaumont Ave
- 76 Joy St
- 86 Beaumont Ave
- 439 Oldfield Rd
- 87 Blanchwood Ave
- 269 Chicopee St Unit 6
- 87 Clarendon Ave
- 343 Chicopee St Unit 14
- 219 Clarendon Ave
- 200 Lambert Terrace Unit 2
- 36 Daley St
- 46 Maplewood Ave
- 89-111 Whitney Ave
- 21 Depot St
- 39 State St
- 35 Lower Grape St
- 80 Brush Hill Ave Unit 61
- 0 School St
- 35 Dublin St
- 583 Mckinstry Ave
Your Personal Tour Guide
Ask me questions while you tour the home.