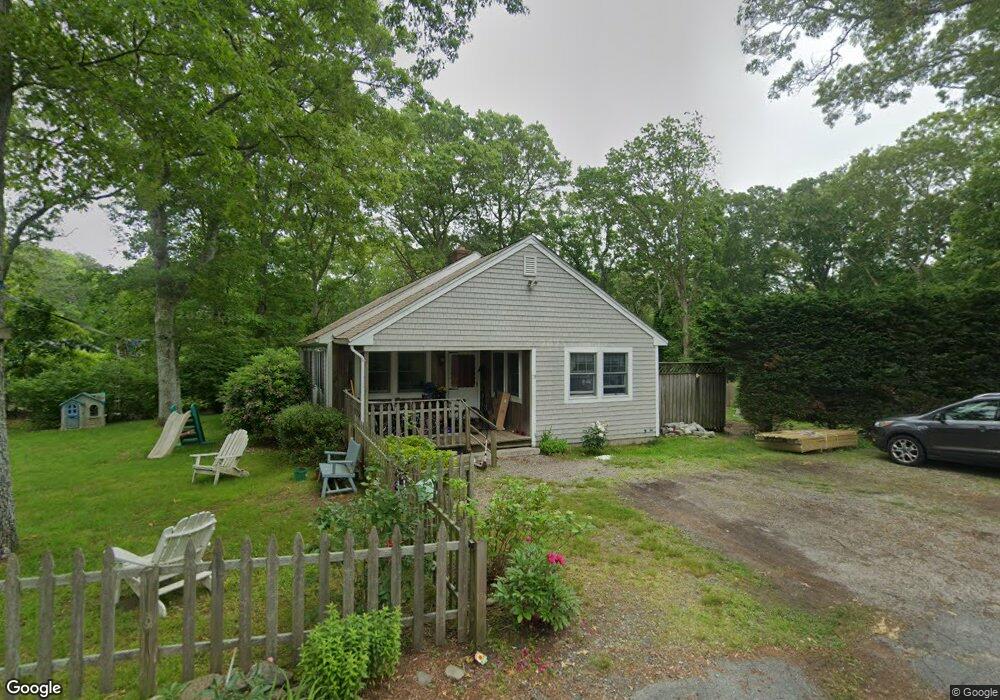
73 Gully Ln Sandwich, MA 02563
Estimated Value: $633,000 - $711,000
3
Beds
3
Baths
1,400
Sq Ft
$478/Sq Ft
Est. Value
About This Home
This home is located at 73 Gully Ln, Sandwich, MA 02563 and is currently estimated at $669,442, approximately $478 per square foot. 73 Gully Ln is a home located in Barnstable County with nearby schools including Sandwich Middle High School, Waldorf School of Cape Cod, and Bridgeview Montessori School.
Ownership History
Date
Name
Owned For
Owner Type
Purchase Details
Closed on
Nov 2, 2012
Sold by
Rogers Raymond D and Rogers Ann M
Bought by
Bromley Jeffrey C and Bromley Tatiana
Current Estimated Value
Home Financials for this Owner
Home Financials are based on the most recent Mortgage that was taken out on this home.
Original Mortgage
$202,500
Outstanding Balance
$138,653
Interest Rate
3.5%
Mortgage Type
New Conventional
Estimated Equity
$530,789
Purchase Details
Closed on
Aug 29, 2006
Sold by
Bromley Ann Marie and Rogers Ann Marie
Bought by
Rogers Ann Marie and Rogers Raymond D
Create a Home Valuation Report for This Property
The Home Valuation Report is an in-depth analysis detailing your home's value as well as a comparison with similar homes in the area
Purchase History
| Date | Buyer | Sale Price | Title Company |
|---|---|---|---|
| Bromley Jeffrey C | $225,000 | -- | |
| Rogers Ann Marie | -- | -- |
Source: Public Records
Mortgage History
| Date | Status | Borrower | Loan Amount |
|---|---|---|---|
| Open | Bromley Jeffrey C | $202,500 |
Source: Public Records
Tax History
| Year | Tax Paid | Tax Assessment Tax Assessment Total Assessment is a certain percentage of the fair market value that is determined by local assessors to be the total taxable value of land and additions on the property. | Land | Improvement |
|---|---|---|---|---|
| 2025 | $5,600 | $529,800 | $210,700 | $319,100 |
| 2024 | $5,196 | $481,100 | $180,000 | $301,100 |
| 2023 | $5,029 | $437,300 | $163,600 | $273,700 |
| 2022 | $4,792 | $364,100 | $143,400 | $220,700 |
| 2021 | $4,595 | $333,700 | $137,300 | $196,400 |
| 2020 | $4,629 | $323,500 | $137,200 | $186,300 |
| 2019 | $4,515 | $315,300 | $140,800 | $174,500 |
| 2018 | $3,068 | $298,500 | $136,000 | $162,500 |
| 2017 | $4,233 | $283,500 | $131,600 | $151,900 |
| 2016 | $3,978 | $274,900 | $126,900 | $148,000 |
| 2015 | $3,892 | $262,600 | $117,400 | $145,200 |
Source: Public Records
Map
Nearby Homes
- 7 Horseshoe Cir
- 363 Service Rd
- 24 Surrey Ln
- 13 Sea Meadow Dr
- 12 Crowell Rd
- 7 Mary Leal Ln
- 2 Rockhill Rd
- 5 Rockhill Rd
- 306 Route 6a
- 306 Route 6a
- 21 Great Island Rd
- 0 Ox Pasture Rd
- 9 Coach Ln
- 8 Dewey Ave
- 78 Highview Dr
- 33 Highview Dr Unit 33
- 2 Marie Ln
- 29 Boulder Brook Rd
- 390 Massachusetts 6a
- 114 Salt Marsh Rd
Your Personal Tour Guide
Ask me questions while you tour the home.