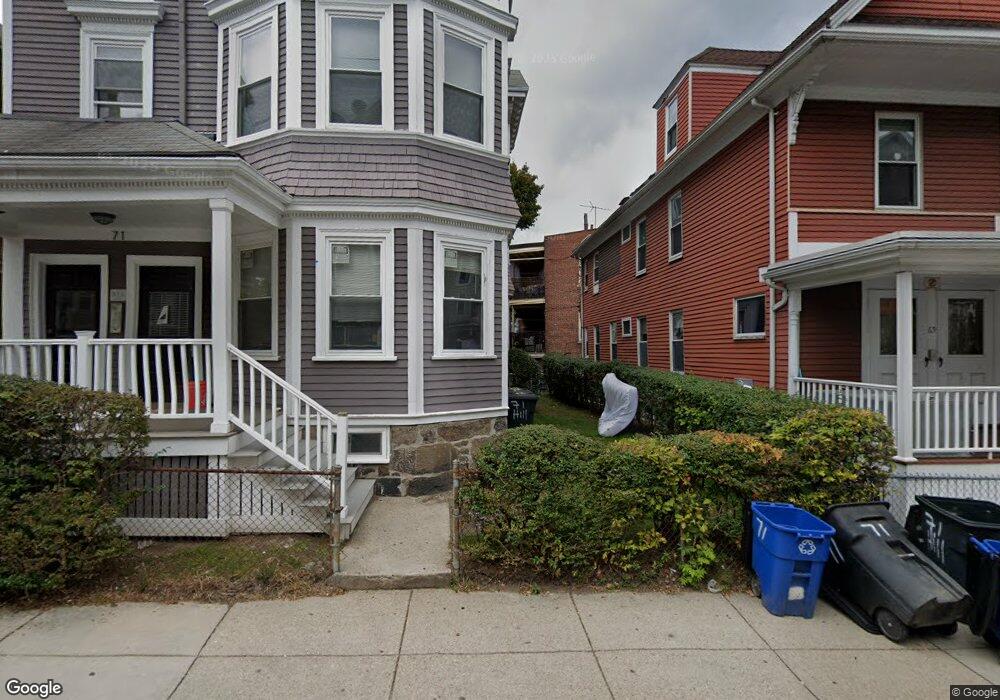
73 Hillside St Roxbury Crossing, MA 02120
Mission Hill NeighborhoodEstimated Value: $2,220,000 - $2,416,792
5
Beds
6
Baths
9,999
Sq Ft
$228/Sq Ft
Est. Value
About This Home
This home is located at 73 Hillside St, Roxbury Crossing, MA 02120 and is currently estimated at $2,279,198, approximately $227 per square foot. 73 Hillside St is a home located in Suffolk County with nearby schools including Malik Academy and Manville School.
Ownership History
Date
Name
Owned For
Owner Type
Purchase Details
Closed on
Oct 16, 2018
Sold by
Mccarthy Timothy F
Bought by
71 Hillside Llc
Current Estimated Value
Home Financials for this Owner
Home Financials are based on the most recent Mortgage that was taken out on this home.
Original Mortgage
$1,155,000
Outstanding Balance
$1,007,229
Interest Rate
4.5%
Mortgage Type
Unknown
Estimated Equity
$1,271,969
Create a Home Valuation Report for This Property
The Home Valuation Report is an in-depth analysis detailing your home's value as well as a comparison with similar homes in the area
Home Values in the Area
Average Home Value in this Area
Purchase History
| Date | Buyer | Sale Price | Title Company |
|---|---|---|---|
| 71 Hillside Llc | $1,540,000 | -- |
Source: Public Records
Mortgage History
| Date | Status | Borrower | Loan Amount |
|---|---|---|---|
| Open | 71 Hillside Llc | $1,155,000 |
Source: Public Records
Tax History Compared to Growth
Tax History
| Year | Tax Paid | Tax Assessment Tax Assessment Total Assessment is a certain percentage of the fair market value that is determined by local assessors to be the total taxable value of land and additions on the property. | Land | Improvement |
|---|---|---|---|---|
| 2025 | $23,455 | $2,025,500 | $525,800 | $1,499,700 |
| 2024 | $20,944 | $1,921,500 | $468,400 | $1,453,100 |
| 2023 | $20,637 | $1,921,500 | $468,400 | $1,453,100 |
| 2022 | $20,292 | $1,865,100 | $454,600 | $1,410,500 |
| 2021 | $18,774 | $1,759,500 | $428,900 | $1,330,600 |
| 2020 | $20,028 | $1,896,600 | $444,100 | $1,452,500 |
| 2019 | $14,789 | $1,403,100 | $306,500 | $1,096,600 |
| 2018 | $13,610 | $1,298,700 | $306,500 | $992,200 |
| 2017 | $12,975 | $1,225,200 | $306,500 | $918,700 |
| 2016 | $11,470 | $1,042,700 | $306,500 | $736,200 |
| 2015 | $10,545 | $870,800 | $275,200 | $595,600 |
| 2014 | $9,327 | $741,400 | $275,200 | $466,200 |
Source: Public Records
Map
Nearby Homes
- 7 Oswald St
- 155-157 Hillside St
- 743 Parker St Unit 3
- 10 Bucknam St Unit 2
- 22 Fisher Ave
- 6 Fisher Ave
- 134-140 Smith St
- 18 Eldora St
- 92 Lawn St Unit 7-160
- 820-824 Huntington Ave
- 130 Minden St
- 1 Centre Street Terrace Unit 7
- 70 Jamaicaway Unit 16
- 249 Roxbury St Unit 1
- 59 Fort Ave
- 50 Jamaicaway Unit 1
- 386 Riverway Unit 4
- 390 Riverway Unit 6
- 390 Riverway Unit 24
- 70 Day St Unit 2
- 73 Hillside St
- 73 Hillside St Unit 2
- 71 Hillside St
- 71 Hillside St Unit 1
- 71 Hillside St Unit 2
- 75 Hillside St Unit 77
- 75 Hillside St Unit 2
- 75 Hillside St Unit 1
- 75 Hillside St Unit B
- 75 Hillside St
- 69 Hillside St
- 69 Hillside St Unit 2
- 77 Hillside St
- 77 Hillside St Unit 3
- 77 Hillside St Unit 1
- 77 Hillside St Unit 2
- 75 Pontiac St
- 71 Pontiac St
- 79 Hillside St
- 79 Hillside St