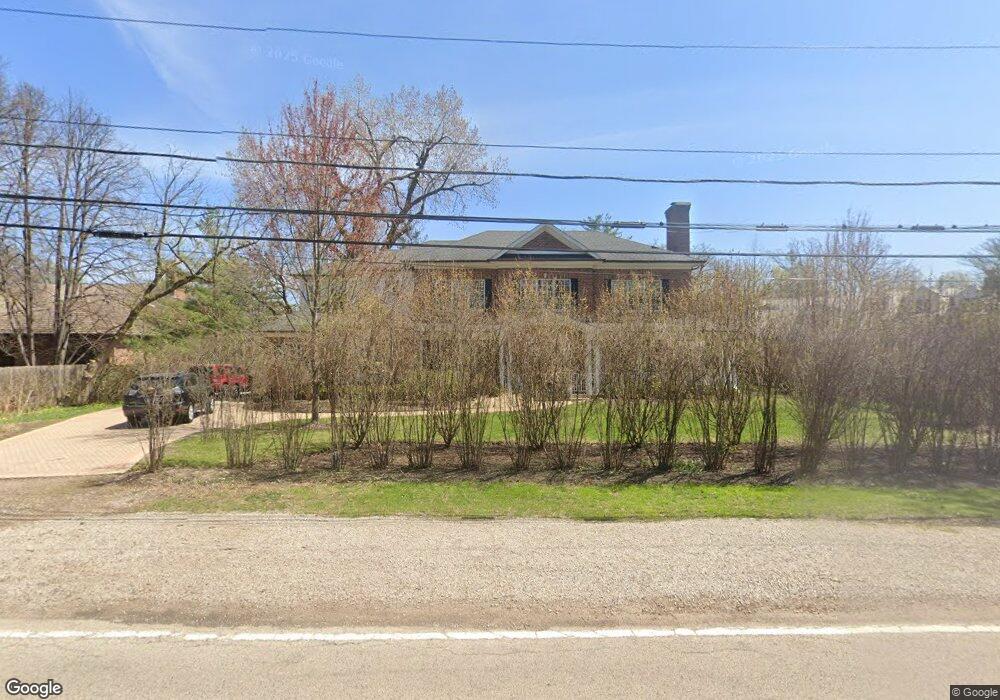
73 Locust Rd Winnetka, IL 60093
Estimated Value: $1,593,000 - $2,418,000
5
Beds
5
Baths
4,089
Sq Ft
$524/Sq Ft
Est. Value
About This Home
This home is located at 73 Locust Rd, Winnetka, IL 60093 and is currently estimated at $2,141,000, approximately $523 per square foot. 73 Locust Rd is a home located in Cook County with nearby schools including Marie Murphy School, Avoca West Elementary School, and New Trier Township High School.
Ownership History
Date
Name
Owned For
Owner Type
Purchase Details
Closed on
Jul 23, 2002
Sold by
First National Bank Of Lagrange
Bought by
Dunkin David C and Wilson Mary Ann
Current Estimated Value
Home Financials for this Owner
Home Financials are based on the most recent Mortgage that was taken out on this home.
Original Mortgage
$300,700
Outstanding Balance
$117,575
Interest Rate
5.62%
Mortgage Type
Unknown
Estimated Equity
$2,023,425
Purchase Details
Closed on
Jul 1, 1998
Sold by
Burke Mary Ellen P
Bought by
First National Bank Of La Grange and Trust #3717
Purchase Details
Closed on
Apr 14, 1995
Sold by
Burke C Kevin and Burke Mary Ellen
Bought by
Burke C Kevin
Create a Home Valuation Report for This Property
The Home Valuation Report is an in-depth analysis detailing your home's value as well as a comparison with similar homes in the area
Home Values in the Area
Average Home Value in this Area
Purchase History
| Date | Buyer | Sale Price | Title Company |
|---|---|---|---|
| Dunkin David C | $1,025,000 | -- | |
| First National Bank Of La Grange | -- | -- | |
| Burke C Kevin | -- | -- |
Source: Public Records
Mortgage History
| Date | Status | Borrower | Loan Amount |
|---|---|---|---|
| Open | Dunkin David C | $300,700 | |
| Closed | Dunkin David C | $519,300 |
Source: Public Records
Tax History Compared to Growth
Tax History
| Year | Tax Paid | Tax Assessment Tax Assessment Total Assessment is a certain percentage of the fair market value that is determined by local assessors to be the total taxable value of land and additions on the property. | Land | Improvement |
|---|---|---|---|---|
| 2024 | $29,180 | $136,908 | $23,479 | $113,429 |
| 2023 | $31,681 | $154,123 | $23,479 | $130,644 |
| 2022 | $31,681 | $166,594 | $23,479 | $143,115 |
| 2021 | $25,983 | $118,300 | $28,510 | $89,790 |
| 2020 | $25,480 | $118,300 | $28,510 | $89,790 |
| 2019 | $24,922 | $130,000 | $28,510 | $101,490 |
| 2018 | $27,539 | $137,000 | $23,479 | $113,521 |
| 2017 | $26,912 | $137,000 | $23,479 | $113,521 |
| 2016 | $29,173 | $152,283 | $23,479 | $128,804 |
| 2015 | $28,529 | $134,498 | $19,286 | $115,212 |
| 2014 | $29,036 | $139,566 | $19,286 | $120,280 |
| 2013 | $31,160 | $153,789 | $19,286 | $134,503 |
Source: Public Records
Map
Nearby Homes
- 43 Indian Hill Rd
- 320 Woodley Rd
- 32 Woodley Rd
- 62 Woodley Rd
- 180 Apple Tree Rd
- 1106 Seneca Rd
- 1024 Pontiac Rd Unit 2
- 2145 Kenilworth Ave
- 640 Hill Rd
- 915 Ottawa Ln
- 909 Ottawa Ln
- 901 Pontiac Rd
- 725 Locust Rd
- 305 Poplar St
- 828 Lavergne Ave
- 1041 Ridge Rd Unit 503
- 801 Harvard St
- 2239 Washington Ave
- 335 Fairview Ave
- 334 Woodland Ave