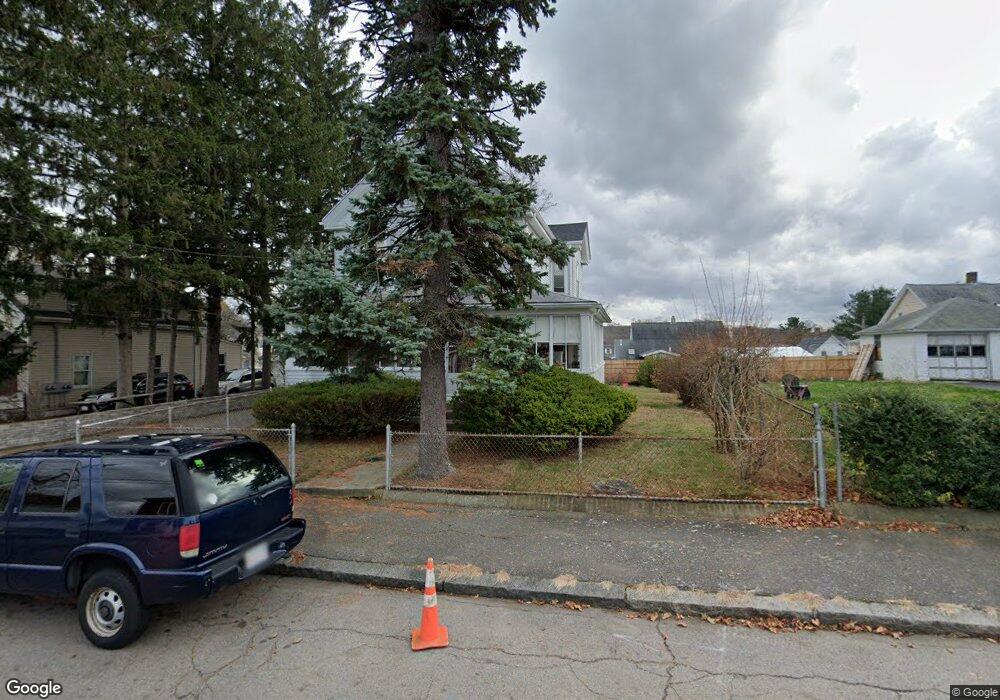
73 Main St Quincy, MA 02169
Quincy Point NeighborhoodEstimated Value: $737,165 - $884,000
4
Beds
1
Bath
2,023
Sq Ft
$399/Sq Ft
Est. Value
About This Home
This home is located at 73 Main St, Quincy, MA 02169 and is currently estimated at $807,291, approximately $399 per square foot. 73 Main St is a home located in Norfolk County with nearby schools including Point Webster Middle School, Clifford H. Marshall Elementary School, and Quincy High School.
Ownership History
Date
Name
Owned For
Owner Type
Purchase Details
Closed on
Oct 30, 1997
Sold by
Parker Ex Esther P
Bought by
Brancaccio John P
Current Estimated Value
Home Financials for this Owner
Home Financials are based on the most recent Mortgage that was taken out on this home.
Original Mortgage
$148,773
Interest Rate
7.31%
Mortgage Type
Purchase Money Mortgage
Create a Home Valuation Report for This Property
The Home Valuation Report is an in-depth analysis detailing your home's value as well as a comparison with similar homes in the area
Home Values in the Area
Average Home Value in this Area
Purchase History
| Date | Buyer | Sale Price | Title Company |
|---|---|---|---|
| Brancaccio John P | $151,000 | -- |
Source: Public Records
Mortgage History
| Date | Status | Borrower | Loan Amount |
|---|---|---|---|
| Open | Brancaccio John P | $62,500 | |
| Open | Brancaccio John P | $150,400 | |
| Closed | Brancaccio John P | $148,773 |
Source: Public Records
Tax History Compared to Growth
Tax History
| Year | Tax Paid | Tax Assessment Tax Assessment Total Assessment is a certain percentage of the fair market value that is determined by local assessors to be the total taxable value of land and additions on the property. | Land | Improvement |
|---|---|---|---|---|
| 2025 | $7,529 | $653,000 | $287,500 | $365,500 |
| 2024 | $7,052 | $625,700 | $273,800 | $351,900 |
| 2023 | $6,487 | $582,800 | $249,000 | $333,800 |
| 2022 | $6,819 | $569,200 | $226,300 | $342,900 |
| 2021 | $6,446 | $531,000 | $226,300 | $304,700 |
| 2020 | $6,347 | $510,600 | $213,500 | $297,100 |
| 2019 | $6,152 | $490,200 | $197,700 | $292,500 |
| 2018 | $5,726 | $429,200 | $179,700 | $249,500 |
| 2017 | $5,698 | $402,100 | $171,200 | $230,900 |
| 2016 | $5,280 | $367,700 | $155,600 | $212,100 |
| 2015 | $4,970 | $340,400 | $146,800 | $193,600 |
| 2014 | $4,797 | $322,800 | $146,800 | $176,000 |
Source: Public Records
Map
Nearby Homes
- 16 Dartmouth St Unit 16
- 32 Sumner St
- 51 Sumner St
- 313 Washington St
- 19 Keyes St
- 187 Washington St
- 161 Sumner St Unit 2
- 161 Sumner St Unit 4
- 25 5th Ave
- 33 Elm St
- 16 Perley Place
- 106 Washington St Unit 45
- 66 Mcgrath Hwy Unit 407
- 66 Mcgrath Hwy Unit 405
- 66 Mcgrath Hwy Unit 308
- 66 Mcgrath Hwy Unit 303
- 66 Mcgrath Hwy Unit 508
- 2 Cliveden St Unit 601E
- 2 Cliveden St Unit 405E
- 59 Spear St Unit 302
- 79 Main St
- 79 Main St Unit 2nd flr
- 79 Main St Unit 2nd Floor
- 114 S Walnut St
- 114 S Walnut St Unit 1
- 110 S Walnut St
- 110 S Walnut St Unit 1
- 69 Main St
- 69 Main St Unit 1
- 69 Main St Unit 2
- 31 Oak St
- 122 S Walnut St
- 7 Oak St
- 85 Main St
- 72 Main St
- 76 Main St
- 72 Main St Unit 1
- 72 Main St Unit 2
- 9999 Berkeley St Unit 1
- 1 Oak St