Estimated Value: $365,688 - $404,000
4
Beds
1
Bath
1,814
Sq Ft
$213/Sq Ft
Est. Value
About This Home
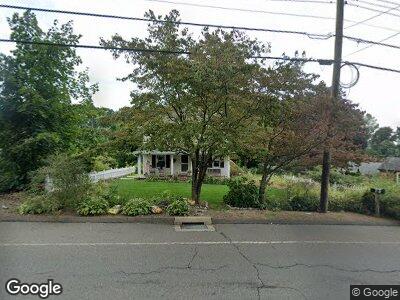
This home is located at 73 Marshall Ln, Derby, CT 06418 and is currently estimated at $386,172, approximately $212 per square foot. 73 Marshall Ln is a home located in New Haven County with nearby schools including Derby Middle School, Derby High School, and Southern Connecticut Hebrew Academy.
Ownership History
Date
Name
Owned For
Owner Type
Purchase Details
Closed on
Sep 19, 1986
Bought by
Libby Karen
Current Estimated Value
Create a Home Valuation Report for This Property
The Home Valuation Report is an in-depth analysis detailing your home's value as well as a comparison with similar homes in the area
Home Values in the Area
Average Home Value in this Area
Purchase History
| Date | Buyer | Sale Price | Title Company |
|---|---|---|---|
| Libby Karen | -- | -- |
Source: Public Records
Mortgage History
| Date | Status | Borrower | Loan Amount |
|---|---|---|---|
| Open | Libby Karen | $188,000 | |
| Closed | Libby Karen | $92,000 | |
| Closed | Libby Karen | $118,500 | |
| Closed | Libby Karen | $121,400 |
Source: Public Records
Tax History Compared to Growth
Tax History
| Year | Tax Paid | Tax Assessment Tax Assessment Total Assessment is a certain percentage of the fair market value that is determined by local assessors to be the total taxable value of land and additions on the property. | Land | Improvement |
|---|---|---|---|---|
| 2024 | $6,810 | $157,640 | $41,300 | $116,340 |
| 2023 | $6,085 | $157,640 | $41,300 | $116,340 |
| 2022 | $6,085 | $157,640 | $41,300 | $116,340 |
| 2021 | $6,085 | $157,640 | $41,300 | $116,340 |
| 2020 | $5,350 | $121,940 | $41,300 | $80,640 |
| 2019 | $5,106 | $121,940 | $41,300 | $80,640 |
| 2018 | $4,801 | $121,940 | $41,300 | $80,640 |
| 2017 | $4,801 | $121,940 | $41,300 | $80,640 |
| 2016 | $4,801 | $121,940 | $41,300 | $80,640 |
| 2015 | $4,628 | $129,500 | $41,300 | $88,200 |
| 2014 | $4,628 | $129,500 | $41,300 | $88,200 |
Source: Public Records
Map
Nearby Homes
- 44 Belleview Dr
- 14 General Wooster Rd
- 40 Derbyshire
- 7 Derbyshire
- 6 Old Farm Rd
- 27 Shelton St
- 127 Pleasant View Rd
- 86 Pulaski Hwy
- 9 Farrel Dr
- 15 Finney Street Extension
- 415 Northwood Dr
- 310 Sentinel Hill Rd
- 204 New Haven Ave Unit 8F
- 953 Rainbow Trail
- 3 Arcadia Cir
- 21 1/2 High Acres Rd
- 50 Laurel Ave
- 129 Benz St
- 196 New Haven Ave Unit 218
- 22 Kindle Ln