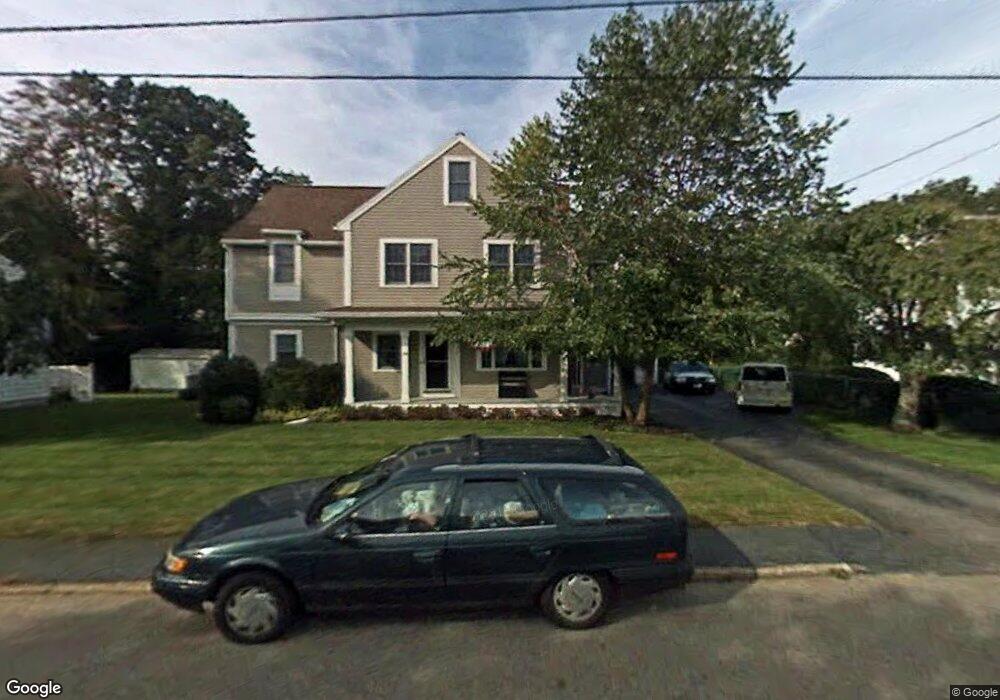
73 Moncrief Rd Rockland, MA 02370
Estimated Value: $876,571 - $1,136,000
5
Beds
4
Baths
3,976
Sq Ft
$242/Sq Ft
Est. Value
About This Home
This home is located at 73 Moncrief Rd, Rockland, MA 02370 and is currently estimated at $964,143, approximately $242 per square foot. 73 Moncrief Rd is a home located in Plymouth County with nearby schools including Rockland Senior High School, Calvary Chapel Academy, and Holy Family Elementary School.
Ownership History
Date
Name
Owned For
Owner Type
Purchase Details
Closed on
Jan 11, 2018
Sold by
Wehner Charles E and Wehner Kathleen M
Bought by
Wehner Ret
Current Estimated Value
Purchase Details
Closed on
May 18, 2010
Sold by
Joyce Thomas J and Joyce Susan A
Bought by
Wehner Charles E and Wehner Kathleen M
Home Financials for this Owner
Home Financials are based on the most recent Mortgage that was taken out on this home.
Original Mortgage
$180,000
Interest Rate
5.11%
Mortgage Type
Purchase Money Mortgage
Purchase Details
Closed on
Mar 22, 2004
Sold by
Rockland Town Of
Bought by
Joyce Thomas J and Cunniff Peter A
Purchase Details
Closed on
Apr 30, 1993
Sold by
Mcpartlin John D and Mcpartlin Mary E
Bought by
Joyce Thomas J and Joyce Susan A
Create a Home Valuation Report for This Property
The Home Valuation Report is an in-depth analysis detailing your home's value as well as a comparison with similar homes in the area
Home Values in the Area
Average Home Value in this Area
Purchase History
| Date | Buyer | Sale Price | Title Company |
|---|---|---|---|
| Wehner Ret | -- | -- | |
| Wehner Charles E | $485,000 | -- | |
| Joyce Thomas J | $100,000 | -- | |
| Joyce Thomas J | $113,050 | -- |
Source: Public Records
Mortgage History
| Date | Status | Borrower | Loan Amount |
|---|---|---|---|
| Previous Owner | Joyce Thomas J | $218,000 | |
| Previous Owner | Wehner Charles E | $180,000 | |
| Previous Owner | Joyce Thomas J | $410,815 |
Source: Public Records
Tax History
| Year | Tax Paid | Tax Assessment Tax Assessment Total Assessment is a certain percentage of the fair market value that is determined by local assessors to be the total taxable value of land and additions on the property. | Land | Improvement |
|---|---|---|---|---|
| 2025 | $11,703 | $856,100 | $265,300 | $590,800 |
| 2024 | $11,466 | $815,500 | $250,300 | $565,200 |
| 2023 | $11,257 | $739,600 | $219,600 | $520,000 |
| 2022 | $10,893 | $650,300 | $190,900 | $459,400 |
| 2021 | $10,270 | $594,300 | $173,600 | $420,700 |
| 2020 | $10,003 | $571,600 | $165,300 | $406,300 |
| 2019 | $9,892 | $552,000 | $157,500 | $394,500 |
| 2018 | $9,589 | $526,300 | $164,600 | $361,700 |
| 2017 | $9,081 | $491,400 | $164,600 | $326,800 |
| 2016 | $8,751 | $473,300 | $158,300 | $315,000 |
| 2015 | $8,360 | $439,300 | $148,000 | $291,300 |
| 2014 | $7,921 | $431,900 | $145,100 | $286,800 |
Source: Public Records
Map
Nearby Homes
- 9 Old Market St
- 823 Market St
- 117 Liberty St
- 5 Pat Rose Way
- 696 Summer St
- 215 Market St
- 810 Brookline Way
- 643 Summer St
- 186 Vernon St
- 41 Winter Cir
- 15 Bradford St
- 50 Linden Park
- 63 Webster St
- 225 W Water St
- 191 Summer St
- 103 Grove St Unit 349
- 0 W Water St
- 119 Grove St Unit 234
- 135 Grove St Unit 123
- 135 Grove St Unit 115
Your Personal Tour Guide
Ask me questions while you tour the home.