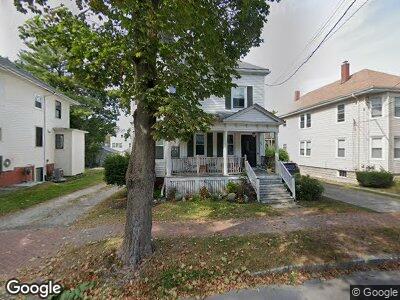
73 Pitt St Portland, ME 04103
Oakdale NeighborhoodEstimated Value: $551,000 - $688,000
4
Beds
1
Bath
1,730
Sq Ft
$362/Sq Ft
Est. Value
About This Home
This home is located at 73 Pitt St, Portland, ME 04103 and is currently estimated at $626,992, approximately $362 per square foot. 73 Pitt St is a home located in Cumberland County with nearby schools including Ocean Avenue Elementary School, King Middle School, and Baxter Academy for Tech & Sciences.
Ownership History
Date
Name
Owned For
Owner Type
Purchase Details
Closed on
Jan 5, 2022
Sold by
Powell Kristen A
Bought by
Thompson Seth
Current Estimated Value
Home Financials for this Owner
Home Financials are based on the most recent Mortgage that was taken out on this home.
Original Mortgage
$327,000
Outstanding Balance
$304,468
Interest Rate
3.12%
Mortgage Type
Purchase Money Mortgage
Estimated Equity
$332,944
Create a Home Valuation Report for This Property
The Home Valuation Report is an in-depth analysis detailing your home's value as well as a comparison with similar homes in the area
Home Values in the Area
Average Home Value in this Area
Purchase History
| Date | Buyer | Sale Price | Title Company |
|---|---|---|---|
| Thompson Seth | -- | None Available |
Source: Public Records
Mortgage History
| Date | Status | Borrower | Loan Amount |
|---|---|---|---|
| Open | Thompson Seth | $327,000 | |
| Previous Owner | Thompson Seth H | $287,000 | |
| Previous Owner | Powell Kristen A | $279,000 | |
| Previous Owner | Thompson Seth H | $24,400 | |
| Previous Owner | Powell Kristen A | $215,000 | |
| Previous Owner | Thompson Seth H | $219,206 | |
| Previous Owner | Hedegard Faye I | $384,037 |
Source: Public Records
Tax History Compared to Growth
Tax History
| Year | Tax Paid | Tax Assessment Tax Assessment Total Assessment is a certain percentage of the fair market value that is determined by local assessors to be the total taxable value of land and additions on the property. | Land | Improvement |
|---|---|---|---|---|
| 2024 | $6,081 | $405,100 | $92,800 | $312,300 |
| 2023 | $5,837 | $405,100 | $92,800 | $312,300 |
| 2022 | $5,513 | $405,100 | $92,800 | $312,300 |
| 2021 | $5,262 | $405,100 | $92,800 | $312,300 |
| 2020 | $5,688 | $244,000 | $87,300 | $156,700 |
| 2019 | $5,688 | $244,000 | $87,300 | $156,700 |
| 2018 | $5,485 | $244,000 | $87,300 | $156,700 |
| 2017 | $5,283 | $244,000 | $87,300 | $156,700 |
| 2016 | $5,151 | $244,000 | $87,300 | $156,700 |
| 2015 | $5,034 | $244,000 | $87,300 | $156,700 |
| 2014 | $4,880 | $244,000 | $87,300 | $156,700 |
Source: Public Records
Map
Nearby Homes
- 82 William St
- 106 Oakdale St
- 29 Falmouth St Unit 2
- 48 Woodmont St
- 23 Deerfield Rd
- 200 Massachusetts Ave
- 62 Roberts St
- 166 Massachusetts Ave
- 52 Melrose St
- 43 Hersey St
- 14 Highland St
- 25 Nevens St Unit 1
- 14 Codman St
- 29 Chenery St
- 160 Craigie St
- 191 Grant St
- 138 Park Ave Unit 6
- 39 Edwards St
- 104 Grant St Unit 105
- 78 Mellen St Unit 6