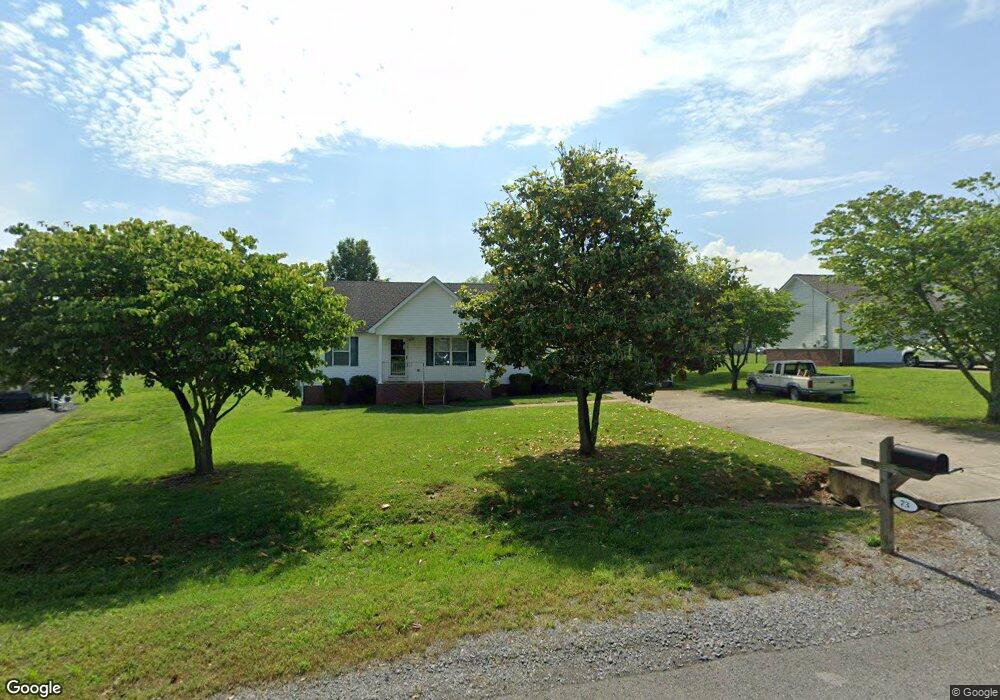
73 Providence Rd Shelbyville, TN 37160
Estimated Value: $260,574 - $319,000
--
Bed
2
Baths
1,288
Sq Ft
$229/Sq Ft
Est. Value
About This Home
This home is located at 73 Providence Rd, Shelbyville, TN 37160 and is currently estimated at $294,644, approximately $228 per square foot. 73 Providence Rd is a home located in Bedford County with nearby schools including South Side Elementary School, Harris Middle School, and Christian Chapel Academy.
Ownership History
Date
Name
Owned For
Owner Type
Purchase Details
Closed on
Apr 21, 2010
Sold by
Hegwood Peggy H
Bought by
Bowling Melissa R
Current Estimated Value
Purchase Details
Closed on
Jul 6, 2004
Sold by
Bobo John T
Bought by
Hegwood Peggy H
Home Financials for this Owner
Home Financials are based on the most recent Mortgage that was taken out on this home.
Original Mortgage
$96,300
Interest Rate
6.25%
Create a Home Valuation Report for This Property
The Home Valuation Report is an in-depth analysis detailing your home's value as well as a comparison with similar homes in the area
Home Values in the Area
Average Home Value in this Area
Purchase History
| Date | Buyer | Sale Price | Title Company |
|---|---|---|---|
| Bowling Melissa R | $99,500 | -- | |
| Hegwood Peggy H | $96,300 | -- |
Source: Public Records
Mortgage History
| Date | Status | Borrower | Loan Amount |
|---|---|---|---|
| Previous Owner | Hegwood Peggy H | $96,300 |
Source: Public Records
Tax History Compared to Growth
Tax History
| Year | Tax Paid | Tax Assessment Tax Assessment Total Assessment is a certain percentage of the fair market value that is determined by local assessors to be the total taxable value of land and additions on the property. | Land | Improvement |
|---|---|---|---|---|
| 2025 | -- | $42,600 | $0 | $0 |
| 2024 | -- | $42,600 | $8,250 | $34,350 |
| 2023 | $1,621 | $42,600 | $8,250 | $34,350 |
| 2022 | $1,668 | $42,600 | $8,250 | $34,350 |
| 2021 | $1,514 | $42,600 | $8,250 | $34,350 |
| 2020 | $1,311 | $42,600 | $8,250 | $34,350 |
| 2019 | $1,311 | $29,600 | $5,750 | $23,850 |
| 2018 | $1,282 | $29,600 | $5,750 | $23,850 |
| 2017 | $1,282 | $29,600 | $5,750 | $23,850 |
| 2016 | $1,270 | $29,600 | $5,750 | $23,850 |
| 2015 | $1,270 | $29,600 | $5,750 | $23,850 |
| 2014 | $1,070 | $27,303 | $0 | $0 |
Source: Public Records
Map
Nearby Homes
- 75 Providence Rd
- 209 Graydon St
- 207 Graydon St
- 301 Graydon St
- 76 Providence Rd
- 102 Sanders St
- 205 Graydon St
- 104 Sanders St
- 78 Providence Rd
- 203 Graydon St
- 214 Graydon St
- 79 Providence Rd
- 300 Graydon St
- 212 Graydon St
- 106 Sanders St
- 303 Graydon St
- 210 Graydon St
- 100 Sanders St
- 80 Providence Rd
- 314 Graydon St