
Landlord's Agent in 2013
Katie Walsh
BHHS C Dan Joyner - Midtown
(864) 525-4861
4 in this area
55 Total Sales

Estimated Value: $206,437 - $226,000
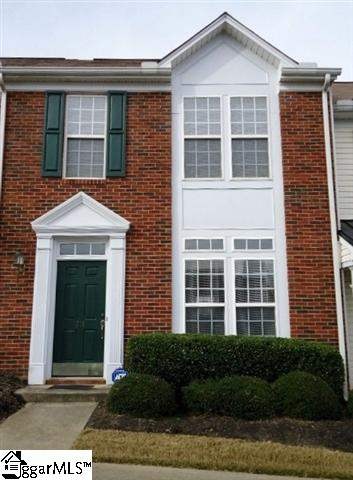
Move in Ready, three Bedroom Condo on the Eastside! If you are looking for an open floor plan with tons of living space, this condo is for you. The kitchen offers updated maple cabinets and a large amount of counter space for your kitchen needs. A formal dining room, a large living room for formal entertaining, and a more relaxed den with a gas fireplace, with a glass door that leads to the semi-private patio. All bedrooms are located on the second level, including the spacious master bedroom with a full bathroom and walk in closet. This community has a pool and some sidewalks as well. Owner is negotiable will pets under 25lbs.
Last Agent to Rent the Property
BHHS C Dan Joyner - Midtown License #72874 Listed on: 12/11/2012
| Date | Buyer | Sale Price | Title Company |
|---|---|---|---|
| Wang Daike | $89,000 | -- | |
| Hud | $107,712 | None Available | |
| Schweier Karl R | $102,026 | -- | |
| R Inc | $79,500 | -- |
| Date | Status | Borrower | Loan Amount |
|---|---|---|---|
| Open | Wang Daike | $66,750 |
| Date | Event | Price | List to Sale | Price per Sq Ft | Prior Sale |
|---|---|---|---|---|---|
| 03/01/2013 03/01/13 | Rented | $995 | -9.5% | -- | |
| 02/01/2013 02/01/13 | Under Contract | -- | -- | -- | |
| 12/11/2012 12/11/12 | For Rent | $1,100 | 0.0% | -- | |
| 12/04/2012 12/04/12 | Sold | $89,000 | -19.1% | $64 / Sq Ft | View Prior Sale |
| 10/17/2012 10/17/12 | Pending | -- | -- | -- | |
| 02/07/2010 02/07/10 | For Sale | $110,000 | -- | $79 / Sq Ft |
| Year | Tax Paid | Tax Assessment Tax Assessment Total Assessment is a certain percentage of the fair market value that is determined by local assessors to be the total taxable value of land and additions on the property. | Land | Improvement |
|---|---|---|---|---|
| 2025 | $2,662 | $7,290 | $1,540 | $5,750 |
| 2024 | $2,662 | $6,340 | $1,040 | $5,300 |
| 2023 | $2,505 | $6,340 | $1,040 | $5,300 |
| 2022 | $2,321 | $6,340 | $1,040 | $5,300 |
| 2021 | $2,288 | $6,340 | $1,040 | $5,300 |
| 2020 | $2,070 | $5,510 | $900 | $4,610 |
| 2019 | $2,070 | $5,510 | $900 | $4,610 |
| 2018 | $2,035 | $5,510 | $900 | $4,610 |
| 2017 | $2,004 | $5,510 | $900 | $4,610 |
| 2016 | $1,951 | $91,820 | $15,000 | $76,820 |
| 2015 | $2,026 | $91,820 | $15,000 | $76,820 |
| 2014 | $1,937 | $88,550 | $15,500 | $73,050 |
Landlord's Agent in 2013
Katie Walsh
BHHS C Dan Joyner - Midtown
(864) 525-4861
4 in this area
55 Total Sales
Seller's Agent in 2012
Wendy Carnes
RE/MAX
(864) 430-5997
5 in this area
65 Total Sales
Buyer's Agent in 2012
Teresa Olbeter
Distinguished Realty of SC
(864) 818-7653
8 in this area
23 Total Sales
Source: Greater Greenville Association of REALTORS®
MLS Number: 1251268
APN: 0535.14-01-037.00
Disclaimer: Certain information contained herein is derived from information provided by parties other than Homes.com. All information provided is deemed reliable, but is not guaranteed to be accurate and should be independently verified.
![]() IDX information is provided exclusively for personal, non-commercial use, and may not be used for any purpose other than to identify prospective properties consumers may be interested in purchasing. Information is deemed reliable but not guaranteed.
IDX information is provided exclusively for personal, non-commercial use, and may not be used for any purpose other than to identify prospective properties consumers may be interested in purchasing. Information is deemed reliable but not guaranteed.
Ask me questions while you tour the home.