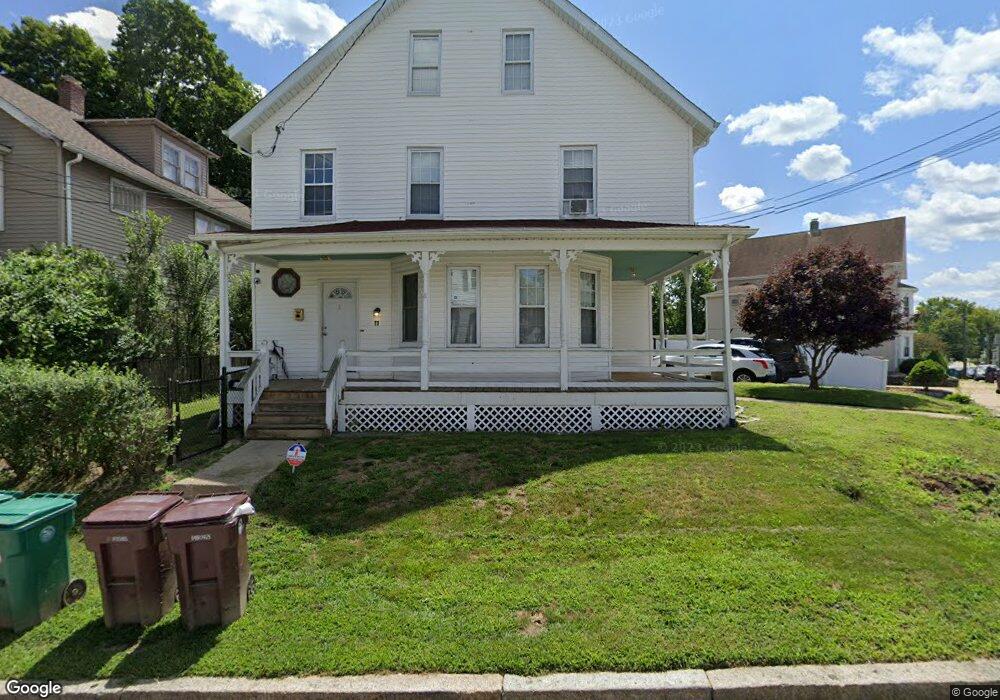
73 Vose St Woonsocket, RI 02895
Globe District NeighborhoodEstimated Value: $407,642 - $526,000
6
Beds
2
Baths
2,614
Sq Ft
$183/Sq Ft
Est. Value
About This Home
This home is located at 73 Vose St, Woonsocket, RI 02895 and is currently estimated at $478,161, approximately $182 per square foot. 73 Vose St is a home located in Providence County with nearby schools including Woonsocket High School, Founders Academy, and Beacon Charter School.
Ownership History
Date
Name
Owned For
Owner Type
Purchase Details
Closed on
May 19, 2006
Sold by
Parrinello Caroline
Bought by
Ohagen Dwayne and Ohagen Keila
Current Estimated Value
Home Financials for this Owner
Home Financials are based on the most recent Mortgage that was taken out on this home.
Original Mortgage
$285,000
Outstanding Balance
$163,439
Interest Rate
6.42%
Mortgage Type
Purchase Money Mortgage
Estimated Equity
$314,722
Purchase Details
Closed on
Jun 19, 2003
Sold by
Berard Robert H and Berard Donna M
Bought by
Parrinello Caroline
Home Financials for this Owner
Home Financials are based on the most recent Mortgage that was taken out on this home.
Original Mortgage
$167,900
Interest Rate
5.71%
Mortgage Type
Purchase Money Mortgage
Purchase Details
Closed on
Nov 2, 1988
Sold by
Smith Stanley
Bought by
Boivin Pauline
Create a Home Valuation Report for This Property
The Home Valuation Report is an in-depth analysis detailing your home's value as well as a comparison with similar homes in the area
Home Values in the Area
Average Home Value in this Area
Purchase History
| Date | Buyer | Sale Price | Title Company |
|---|---|---|---|
| Ohagen Dwayne | $295,000 | -- | |
| Ohagen Dwayne | $295,000 | -- | |
| Parrinello Caroline | $210,000 | -- | |
| Parrinello Caroline | $210,000 | -- | |
| Boivin Pauline | $142,500 | -- |
Source: Public Records
Mortgage History
| Date | Status | Borrower | Loan Amount |
|---|---|---|---|
| Open | Boivin Pauline | $285,000 | |
| Closed | Boivin Pauline | $285,000 | |
| Previous Owner | Boivin Pauline | $167,900 |
Source: Public Records
Tax History
| Year | Tax Paid | Tax Assessment Tax Assessment Total Assessment is a certain percentage of the fair market value that is determined by local assessors to be the total taxable value of land and additions on the property. | Land | Improvement |
|---|---|---|---|---|
| 2025 | $5,098 | $454,000 | $105,400 | $348,600 |
| 2024 | $4,442 | $305,500 | $93,500 | $212,000 |
| 2023 | $4,271 | $305,500 | $93,500 | $212,000 |
| 2022 | $4,271 | $305,500 | $93,500 | $212,000 |
| 2021 | $3,867 | $162,800 | $57,800 | $105,000 |
| 2020 | $3,907 | $162,800 | $57,800 | $105,000 |
| 2018 | $3,920 | $162,800 | $57,800 | $105,000 |
| 2017 | $4,163 | $138,300 | $46,000 | $92,300 |
| 2016 | $4,403 | $138,300 | $46,000 | $92,300 |
| 2015 | $5,059 | $138,300 | $46,000 | $92,300 |
| 2014 | $4,445 | $135,900 | $50,500 | $85,400 |
Source: Public Records
Map
Nearby Homes
- 42 Transit St
- 43 Summit St
- 190 Coe St
- 0 Holbrook Ln Unit 1402850
- 184 Avenue C Unit 2
- 184 Avenue C Unit 5
- 184 Avenue C Unit 6
- 184 Avenue C Unit 3
- 184 Avenue C Unit 4
- 184 Avenue C Unit 1
- 122 Grand St
- 435 S Main St
- 635 Park Ave
- 120 East St
- 1 Admiral St
- 84 Bernice Ave
- 379 Front St
- 15 Knight St
- 92 Rockland Ave
- 87 Kermit St
- 0 Jenckes St Unit 661647
- 0 Jenckes St Unit 663776
- 0 Jenckes St Unit 1075003
- 79 Vose St
- 74 Vose St
- 66 Vose St
- 84 Vose St
- 26 Jenckes St
- 94 Vose St
- 43 Vose St
- 34 & 50 Jenckes St
- 46 Vose St
- 34 Jenckes St
- 34 Jenckes St Unit 2
- 111 Vose St
- 44 Vose St
- 33 Vose St
- 50 Jenckes St
- 50 Jenckes St Unit 1R
- 34 Vose St
Your Personal Tour Guide
Ask me questions while you tour the home.