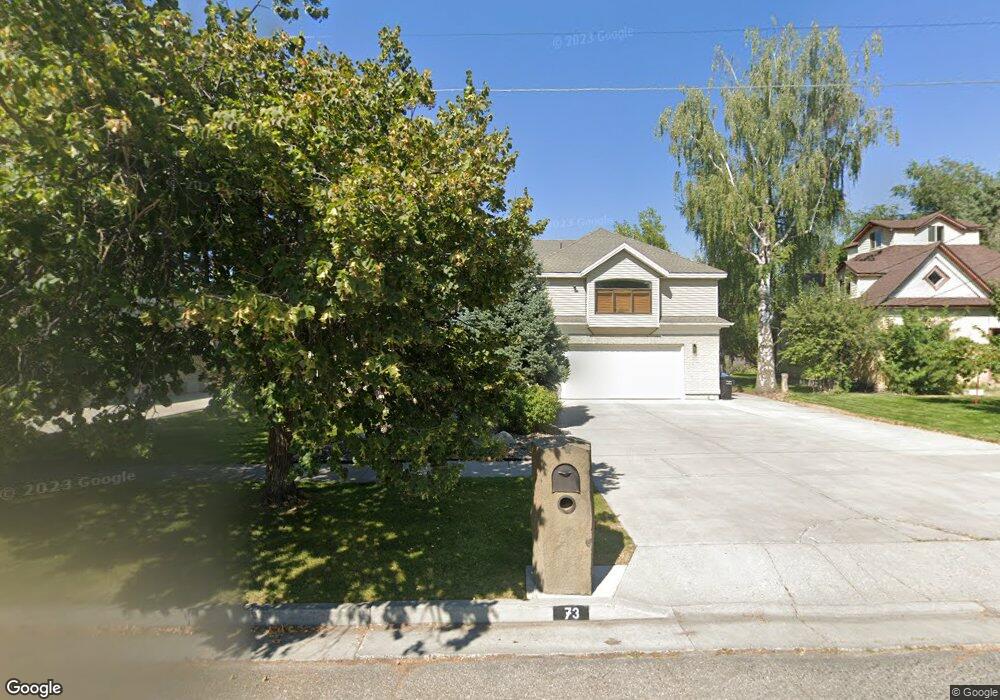
73 W 200 N Smithfield, UT 84335
Estimated Value: $543,000 - $617,000
4
Beds
3
Baths
3,114
Sq Ft
$184/Sq Ft
Est. Value
About This Home
This home is located at 73 W 200 N, Smithfield, UT 84335 and is currently estimated at $572,973, approximately $183 per square foot. 73 W 200 N is a home located in Cache County with nearby schools including Summit School, North Cache Middle School, and White Pine Middle School.
Ownership History
Date
Name
Owned For
Owner Type
Purchase Details
Closed on
Feb 3, 2023
Sold by
Williams Justin Neal and Williams Janice West
Bought by
Janice Lee Williams Revocable Trust
Current Estimated Value
Purchase Details
Closed on
Dec 8, 2015
Sold by
Emile Mark A
Bought by
Williams Justin Neal and Williams Janice West
Create a Home Valuation Report for This Property
The Home Valuation Report is an in-depth analysis detailing your home's value as well as a comparison with similar homes in the area
Home Values in the Area
Average Home Value in this Area
Purchase History
| Date | Buyer | Sale Price | Title Company |
|---|---|---|---|
| Janice Lee Williams Revocable Trust | -- | None Listed On Document | |
| Williams Justin Neal | -- | Hickman Land Title Company |
Source: Public Records
Tax History
| Year | Tax Paid | Tax Assessment Tax Assessment Total Assessment is a certain percentage of the fair market value that is determined by local assessors to be the total taxable value of land and additions on the property. | Land | Improvement |
|---|---|---|---|---|
| 2025 | $30 | $397,055 | $0 | $0 |
| 2024 | $3,053 | $383,345 | $0 | $0 |
| 2023 | $3,199 | $379,960 | $0 | $0 |
| 2022 | $3,110 | $363,380 | $0 | $0 |
| 2021 | $2,970 | $470,635 | $71,500 | $399,135 |
| 2020 | $2,731 | $395,304 | $71,500 | $323,804 |
| 2019 | $2,317 | $336,854 | $47,800 | $289,054 |
| 2018 | $2,180 | $306,500 | $47,800 | $258,700 |
| 2016 | $1,676 | $138,105 | $0 | $0 |
| 2015 | $1,682 | $138,105 | $0 | $0 |
| 2014 | $1,650 | $138,110 | $0 | $0 |
| 2013 | -- | $138,110 | $0 | $0 |
Source: Public Records
Map
Nearby Homes
Your Personal Tour Guide
Ask me questions while you tour the home.