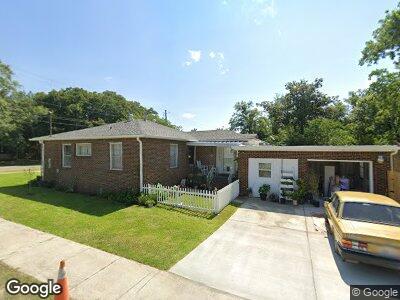
73 W Grant St Mobile, AL 36611
Estimated Value: $63,000 - $79,000
3
Beds
1
Bath
1,290
Sq Ft
$55/Sq Ft
Est. Value
About This Home
This home is located at 73 W Grant St, Mobile, AL 36611 and is currently estimated at $71,227, approximately $55 per square foot. 73 W Grant St is a home located in Mobile County with nearby schools including Chickasaw City Elementary School, Chickasaw City High School, and Word Of Life Institute Christian School.
Ownership History
Date
Name
Owned For
Owner Type
Purchase Details
Closed on
Dec 11, 2020
Sold by
Engram Bernice
Bought by
Engram Myrtle
Current Estimated Value
Purchase Details
Closed on
Apr 25, 2019
Sold by
Engram Bernice
Bought by
Engram Bernice
Purchase Details
Closed on
Feb 20, 1999
Sold by
Alya Brenda Ann Abu
Bought by
Engram Vivian D
Home Financials for this Owner
Home Financials are based on the most recent Mortgage that was taken out on this home.
Original Mortgage
$54,000
Interest Rate
6.73%
Create a Home Valuation Report for This Property
The Home Valuation Report is an in-depth analysis detailing your home's value as well as a comparison with similar homes in the area
Home Values in the Area
Average Home Value in this Area
Purchase History
| Date | Buyer | Sale Price | Title Company |
|---|---|---|---|
| Engram Myrtle | $39,900 | None Available | |
| Engram Bernice | -- | None Available | |
| Engram Vivian D | -- | -- | |
| Engram Vivian D | -- | -- | |
| Engram Vivian D | -- | -- |
Source: Public Records
Mortgage History
| Date | Status | Borrower | Loan Amount |
|---|---|---|---|
| Previous Owner | Engram Vivian D | $54,000 |
Source: Public Records
Tax History Compared to Growth
Tax History
| Year | Tax Paid | Tax Assessment Tax Assessment Total Assessment is a certain percentage of the fair market value that is determined by local assessors to be the total taxable value of land and additions on the property. | Land | Improvement |
|---|---|---|---|---|
| 2024 | $625 | $11,680 | $1,200 | $10,480 |
| 2023 | $552 | $10,320 | $1,200 | $9,120 |
| 2022 | $508 | $9,500 | $1,200 | $8,300 |
| 2021 | $464 | $8,680 | $1,100 | $7,580 |
| 2020 | $464 | $8,680 | $1,100 | $7,580 |
| 2019 | $427 | $7,980 | $1,120 | $6,860 |
| 2018 | $426 | $7,960 | $0 | $0 |
| 2017 | $145 | $4,000 | $0 | $0 |
| 2016 | $254 | $6,060 | $0 | $0 |
| 2013 | $306 | $6,540 | $0 | $0 |
Source: Public Records
Map
Nearby Homes