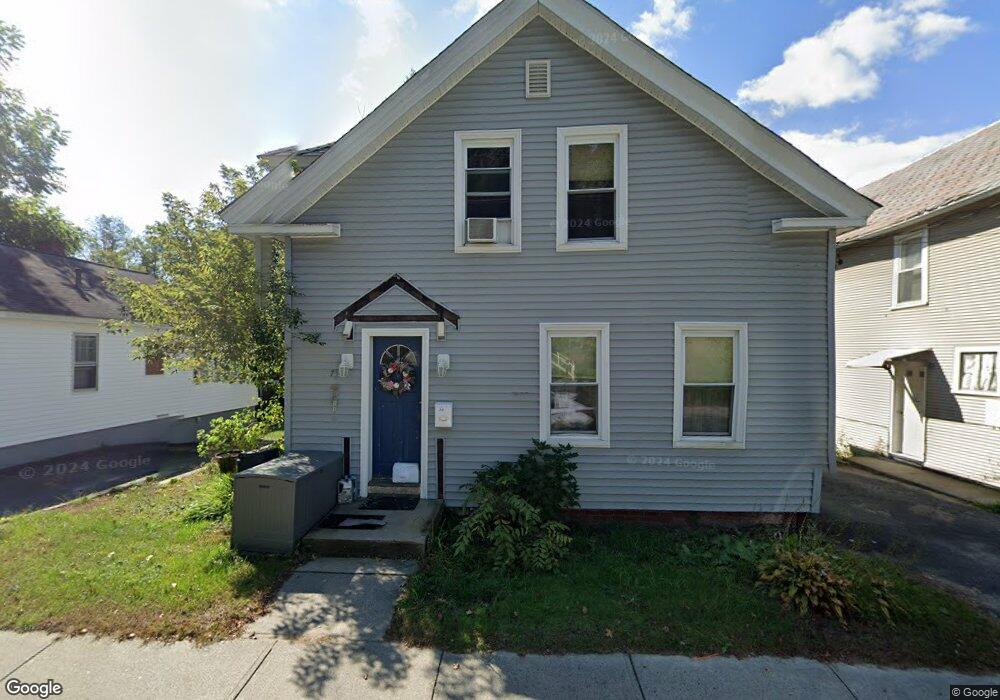
73 W Main St Orange, MA 01364
Estimated Value: $236,000 - $267,246
4
Beds
2
Baths
1,080
Sq Ft
$229/Sq Ft
Est. Value
About This Home
This home is located at 73 W Main St, Orange, MA 01364 and is currently estimated at $247,312, approximately $228 per square foot. 73 W Main St is a home located in Franklin County with nearby schools including Fisher Hill and Ralph C Mahar Regional School.
Ownership History
Date
Name
Owned For
Owner Type
Purchase Details
Closed on
Apr 24, 2002
Sold by
Pederzini Luigi and Johnson David S
Bought by
Arsenault Jamie K and Arsenault Melissa M
Current Estimated Value
Home Financials for this Owner
Home Financials are based on the most recent Mortgage that was taken out on this home.
Original Mortgage
$72,675
Interest Rate
7.05%
Mortgage Type
Purchase Money Mortgage
Purchase Details
Closed on
Dec 12, 2001
Sold by
Biegen Tawny R
Bought by
Pederzini Luigi
Purchase Details
Closed on
Feb 26, 1996
Sold by
Guguay Troy E and Duguay Allyson
Bought by
Biegen Tawny R
Home Financials for this Owner
Home Financials are based on the most recent Mortgage that was taken out on this home.
Original Mortgage
$59,000
Interest Rate
7.04%
Mortgage Type
Purchase Money Mortgage
Create a Home Valuation Report for This Property
The Home Valuation Report is an in-depth analysis detailing your home's value as well as a comparison with similar homes in the area
Home Values in the Area
Average Home Value in this Area
Purchase History
| Date | Buyer | Sale Price | Title Company |
|---|---|---|---|
| Arsenault Jamie K | $73,250 | -- | |
| Pederzini Luigi | $35,000 | -- | |
| Biegen Tawny R | $59,000 | -- |
Source: Public Records
Mortgage History
| Date | Status | Borrower | Loan Amount |
|---|---|---|---|
| Open | Biegen Tawny R | $104,125 | |
| Closed | Biegen Tawny R | $84,500 | |
| Closed | Biegen Tawny R | $72,675 | |
| Previous Owner | Biegen Tawny R | $59,000 |
Source: Public Records
Tax History
| Year | Tax Paid | Tax Assessment Tax Assessment Total Assessment is a certain percentage of the fair market value that is determined by local assessors to be the total taxable value of land and additions on the property. | Land | Improvement |
|---|---|---|---|---|
| 2025 | $34 | $204,700 | $19,000 | $185,700 |
| 2024 | $3,174 | $182,000 | $19,000 | $163,000 |
| 2023 | $2,796 | $155,700 | $19,000 | $136,700 |
| 2022 | $2,535 | $132,600 | $19,000 | $113,600 |
| 2021 | $2,594 | $129,400 | $40,700 | $88,700 |
| 2020 | $2,505 | $123,200 | $39,200 | $84,000 |
| 2019 | $2,520 | $111,900 | $37,400 | $74,500 |
| 2018 | $2,258 | $102,900 | $36,000 | $66,900 |
| 2017 | $2,185 | $102,900 | $36,000 | $66,900 |
| 2016 | $2,122 | $97,800 | $36,000 | $61,800 |
| 2015 | $1,998 | $96,200 | $36,000 | $60,200 |
| 2014 | $2,039 | $103,300 | $36,000 | $67,300 |
Source: Public Records
Map
Nearby Homes
- 83 W Main St
- 35 Ball St
- 36 Summit St Unit A
- 36 Summit St Unit B
- 166-168 W Main St
- 30 Cottage St
- 12-14 E Main St
- 22 School St
- 56 Shelter St
- 50 E Main St
- 58 E Main St
- 222 W River St
- 23 E Howe St
- 270 S Main St
- 313-315 Walnut Hill Rd
- 490 S Main St
- 216 Holtshire Rd
- 549 E Main St
- 00 S Main St
- 000 S Main St
Your Personal Tour Guide
Ask me questions while you tour the home.